


Filtering Out the Noise


Seasonally adjusting housing market data filters out a number of factors that can distort the data. By doing so, it gives analysts a more accurate picture of housing market changes. |
Have you ever noticed the volatility in housing data? Monthly headlines seem to cycle between sales going up and sales going down, and then back up, and then back down. These systematic fluctuations make it difficult to decipher meaningful movements in the market. Analysts attempt to filter out this noise to take a more precise pulse of the data. More accurate data allow for better decision making and planning.
It is no surprise that Texas housing sales were higher in June 2019 than they were in January of the same year. Since 1990 (the earliest year for which data are available), the number of closed listings in June has been more than double the respective January total. While the differences are smaller when comparing consecutive months (e.g., June versus July), they still distort fundamental changes in the series. Market participants and policymakers are interested in how economic variables (such as interest rates and income) and regulations (for example, zoning and permitting) affect housing sales and prices.
To analyze these impacts, researchers filter out seasonal movements in the data (for example, sales activity consistently stalls on Christmas Eve and Christmas Day, but not because market conditions suffer over the holidays). Seasonal adjustment processes control for factors that affect sales in the same way every year, providing a clearer picture of the current market (see figure). While the seasonally adjusted (SA) sales do not exhibit annual peaks and valleys like the raw data, they still mirror more minor movements caused by non-calendar factors. This comovement corroborates that the SA series captures important changes in the actual data.

Another tool commonly employed to avoid seasonality is a year-over-year (YOY) comparison. For example, Texas housing sales fell 12 percent in December 2018 relative to December 2017. Seasonal factors such as Christmas, winter break for schools, and colder weather cannot explain the decline because they occur every December. On the contrary, higher mortgage rates and concerns of a recession characterized the end of 2018 and weighed on the housing market.
While effectively removing seasonality, YOY comparisons still suffer from high levels of volatility because they rely on just two data points. Suppose December 2017 sales had spiked uncharacteristically, perhaps due to anticipations of tax reform. This spike wouldn’t reflect a change in market conditions, but rather the fact that transactions that would have occurred in January were rushed to close before year-end. In this scenario, even if sales activity was normal in December 2018, the YOY change would be negative.
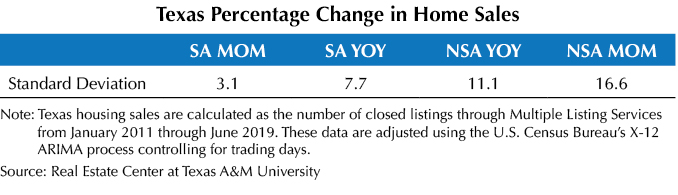
Seasonal adjustment processes, however, use information from all of the historical data rather than just two data points. This provides a more stable comparison and reduces volatility. In fact, YOY comparisons are improved when calculated with seasonally adjusted data (see table). This improvement is driven by the flexibility of seasonal adjustment procedures, the most common of which is the X-12 ARIMA technique developed by the U.S. Census Bureau.
In addition to standard seasonal adjustments, X-12 can control for business or trading days. Distinguishing business days from holidays or weekends is critical in the housing market. For example, 98 percent of closings occur on business days, with 48 percent of all closings on either Mondays or Fridays. This nuance adds noise to unadjusted data. Consider again the 12 percent YOY decline in December 2018. While market jitters certainly played a role, there were also two fewer business days than in December 2017. After adjusting the data, the YOY decline shrinks to 5.1 percent.
Not only are YOY comparisons a noisy measure, but they do not capture contemporaneous trends. Texas sales reached a trough in September 2010 in the aftermath of the Great Recession before the fracking boom launched the economy into the current expansion. Although the recovery began during fourth quarter 2010, YOY calculations indicated contractions until June 2011. These contractions were slowing, but the inherent volatility hindered that determination in real time.
The primary benefit of seasonal adjustment is that it allows for meaningful month-over-month (MOM) comparisons. Recall the folly of comparing the difference in raw sales between June and July, which suffers from recurring seasonal bias (namely, Independence Day). Once the data are adjusted, MOM calculations are no longer problematic and provide up-to-date measures of market activity.
Just as there is no single variable that perfectly describes the economy, there is no single measure that perfectly describes changes in most economic series (e.g., housing sales). Which measure to employ depends on the question of interest. Sometimes researchers want to know how things have changed over the past year or decade. Other times they want to know what the most recent changes were or where the market is heading.
Regardless of the selected measure, it is important to understand the intricacies and nuances of the data being analyzed. When these data are provided at a monthly or quarterly frequency, seasonal adjustment may be critical for accurate analysis and interpretation.
____________________
Dr. Torres ([email protected]) is a research economist and Miller ([email protected]) a research associate with the Real Estate Center at Texas A&M University.
You might also like

TG Magazine
Check out the latest issue of our flagship publication.