


Out of Reach?


Although Texas’ housing market as a whole remains relatively affordable, a recent shift from lower-priced, entry-level new homes to more expensive homes has reduced affordability for lower-income earners in some markets. To alleviate this pressure, incomes need to catch up with home prices, and more entry-level housing needs to either be built or returned to the for-sale market from the rental market. |
Home price growth has outpaced disposable income growth since the end of the housing market collapse, causing housing affordability to decline nationally, including in Texas. What does housing affordability look like across the entire income distribution spectrum? How has it varied in recent years? How does it vary among the major metros?
Generally speaking, housing affordability refers to the proportion of housing that is affordable at various income levels or to the proportion of households that can afford housing at various price points. More often, affordability indexes depict whether the median income is enough for a household or family to qualify for a mortgage on the median-priced home. The Center follows this measurement and produces a quarterly median-based affordability index for the state, all metro areas, and select counties. While the index serves as a useful measure, it does not paint the entire affordability picture because incomes and home prices extend above and below the median to varying degrees over time and across MSAs.
Home Price Trends
Housing has been impacted by changes in income distribution resulting from technology changes and offshoring of jobs. Just as income distributions have varied over the years (see sidebar), so have housing values and price distributions. Research shows there are proportionally more higher-priced than lower-priced homes. The variance in home values decreased from 1930 to 1970 but increased after 1970 as income distribution gaps widened. This wider range of home values is mainly because of varying land-use restrictions within cities, which increase land values. Construction costs remain fairly constant within cities.
Despite average household sizes shrinking, new homes have gotten larger and, as a result, more expensive. In 2015, the median square footage of new single-family homes in the United States was 2,467 compared with 1,525 in 1973. Similarly, new homes in the southern U.S.—which includes Texas—jumped from a median size of 1,555 square feet in 1973 to 2,517 in 2015. Meanwhile, the average number of persons per household declined from approximately 3.1 in 1970 to 2.65 in 2016 nationally, and from 3.2 to 2.86 in Texas.
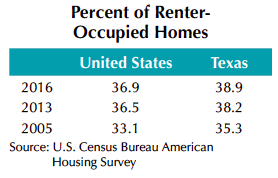
The inventory of owner-occupied, entry-level homes decreased as a proportion of total housing stock as well as inventory available for sale. From 2005 to 2013, the national stock of owner-occupied starter homes (less than 2,000 square feet) decreased by more than one million while the stock of renter-occupied starter homes increased by almost two million. This was largely because investors took advantage of foreclosure and short-sales during the financial crisis and converted homes to rentals. Beyond starter homes, housing shifted from owner-occupied to renter-occupied status (see table).
Because of economic factors such as high land values, high construction costs, and more stringent financing, developers prefer building larger, expensive homes rather than lower-priced, entry-level homes. As a result, there are fewer lower-priced new homes on the market, making older, smaller, existing homes the only low-priced housing option.
Housing Affordability in Texas
Housing affordability is not consistent for all households. It can vary according to household composition, financial situation, ability to obtain financing, housing prices, interest rates, and other determinants.
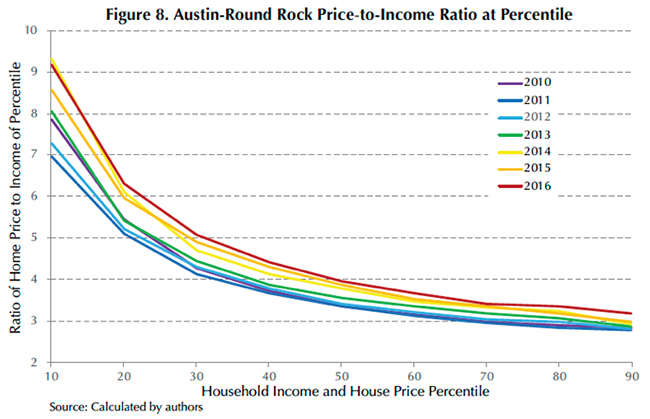
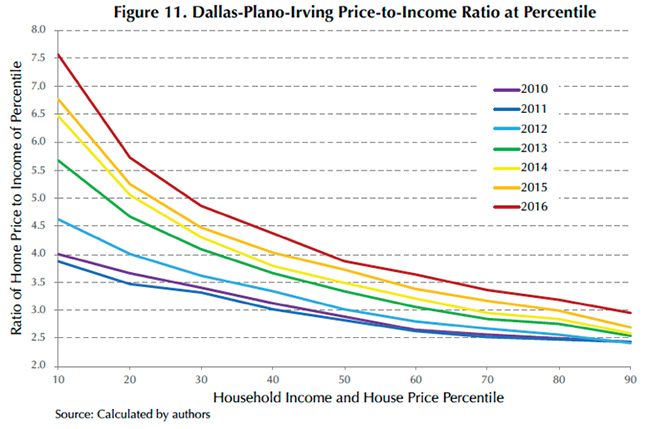
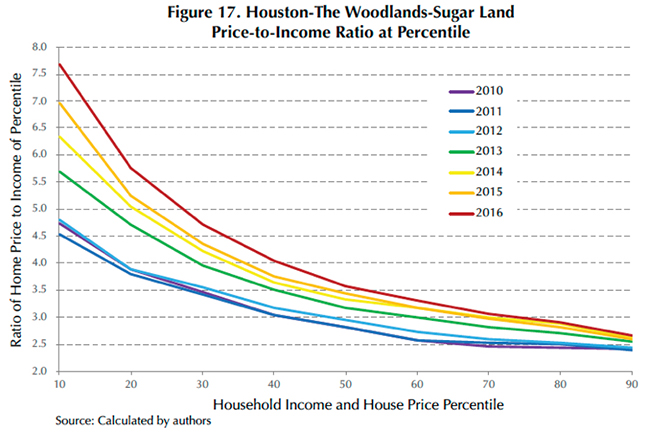
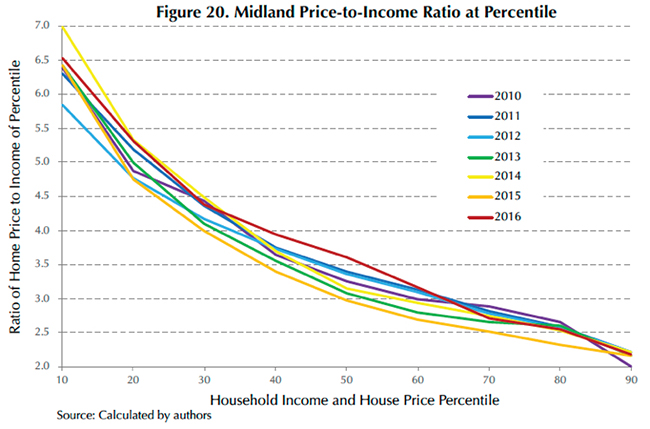
Home price can be viewed as a multiple of household income at a given percentile (Figure 1). The vertical axis represents the ratio of house price to household income for the same percentile shown on the horizontal axis. For example, in 2016, the 40th percentile house price was $182,500, and the 40th percentile household income was approximately $44,350, yielding a price-to-income ratio of 4.1. This means that the 40th percentile house price is 4.1 times the 40th percentile household income.
Generally, this ratio is smaller at higher income percentiles than at lower ones. Price changes in Texas were muted following the financial crisis until the end of 2011, while the nation experienced declines. Texas prices gained momentum starting in early 2012 and increased at a faster rate than income growth. The ratio between prices and income increases each year. The ratio is higher at lower income percentiles (Figure 1).

Affordability is not just the relationship between housing prices and incomes. Interest rates are also a factor. They declined from 2011 to 2012, increased in 2013 and 2014, then decreased again in 2015 and 2016. While the first figure simply presented a ratio of housing price to income, the next two incorporate prevailing interest rates and estimate the proportion of housing sold that was affordable at any given income level.
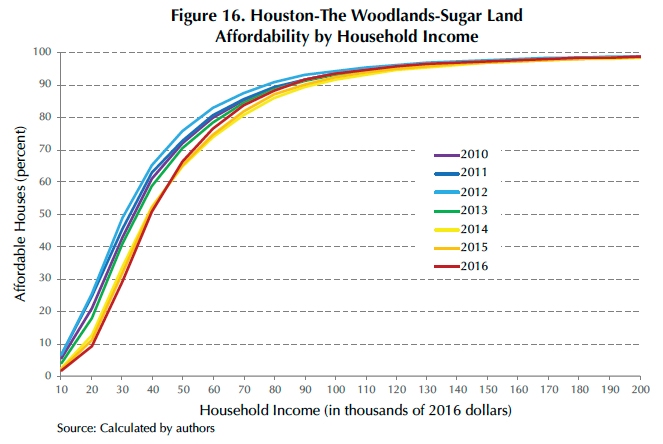
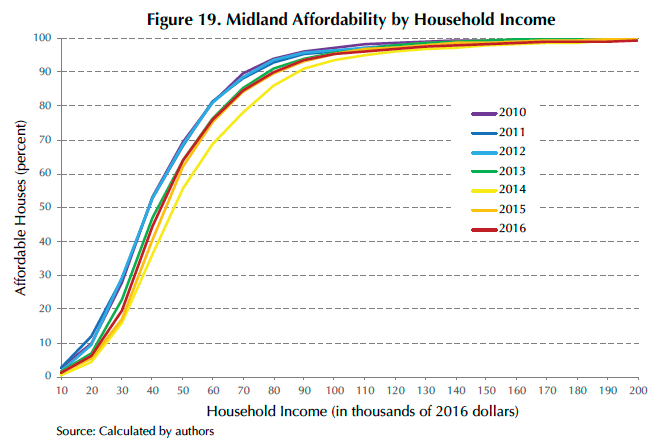
Estimates show how much of the for-sale housing inventory is affordable for each level of income (Figure 2). Household income is presented in increments of $10,000 and inflation-adjusted to 2016 dollars for annual comparison. From 2011 to 2012, the proportion of affordable houses increased, greatly influenced by effective interest rates dropping nearly 90 basis points. In subsequent years, however, home prices soared and affordability decreased despite declining interest rates.
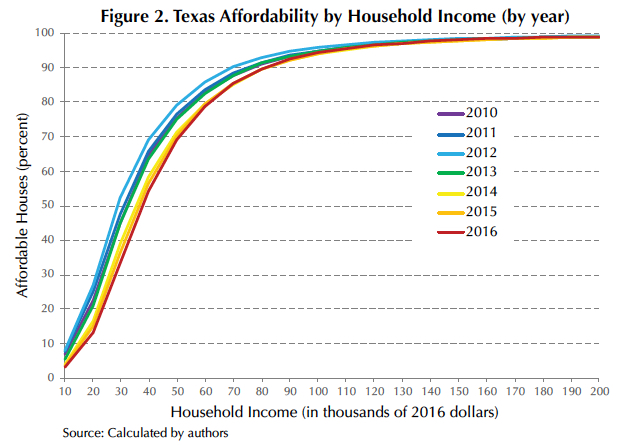
With builders focusing more on high-end housing, the proportion of housing not affordable to lower-income households has increased. While the proportion of affordable housing increases with income, the marginal proportion of housing that becomes affordable decreases as income increases. For example, in 2016, as income increased from $40,000 to $50,000, almost 15 percent more homes became affordable. A shift from $90,000 to $100,000 opened up only an additional 2 percent.
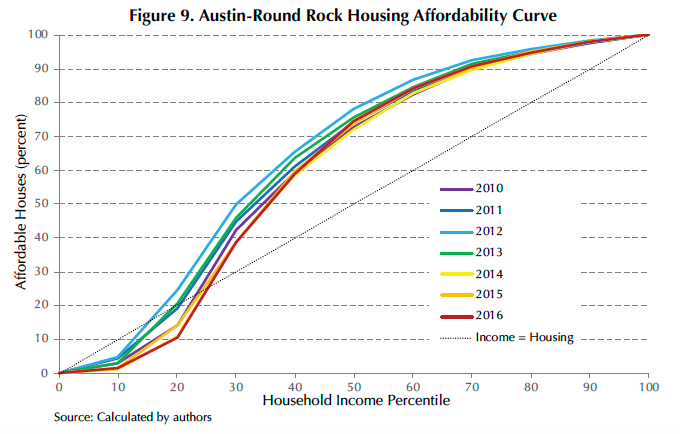
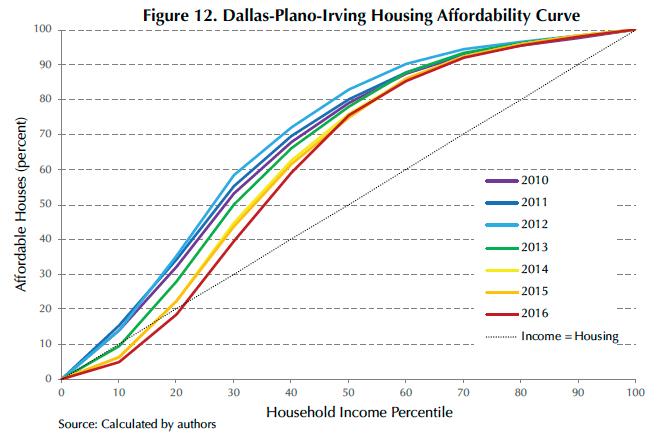
The Housing Affordability Curve (Figure 3) also shows the proportion of housing inventory affordable to a particular income level, but it uses percentiles rather than dollars. Some housing affordability proponents argue that, in an ideal world, each income percentile would have a proportionate amount of affordable housing stock (demonstrated by the line "Income=Housing"). For example, the 20th percentile could afford 20 percent of the housing inventory, the 60th percentile could afford 60 percent, etc. However, this is not the case in the real world.
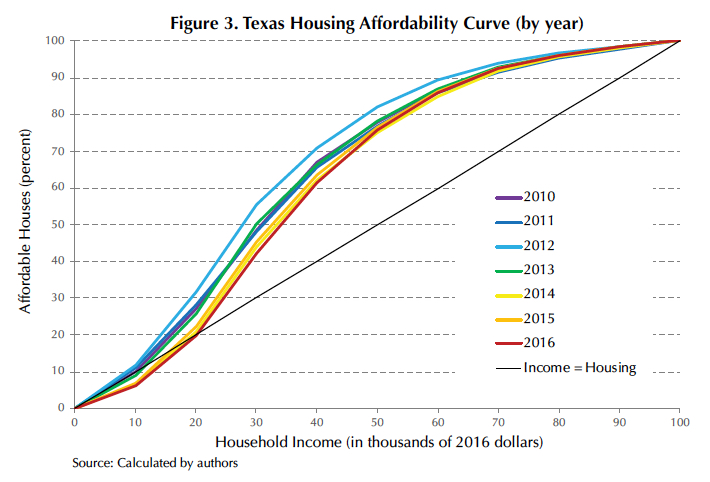
For all years, the amount of affordable housing available to those earning above the 20th percentile income level exceeded the ideal. In 2011 and 2012, this was also true for households below the 20th percentile income level.
After 2013, affordability began to erode for lower-income earners as the housing price distribution shifted to more expensive housing; a decrease in lower-priced, entry-level new construction; and higher prices overall.
At the Metropolitan Level
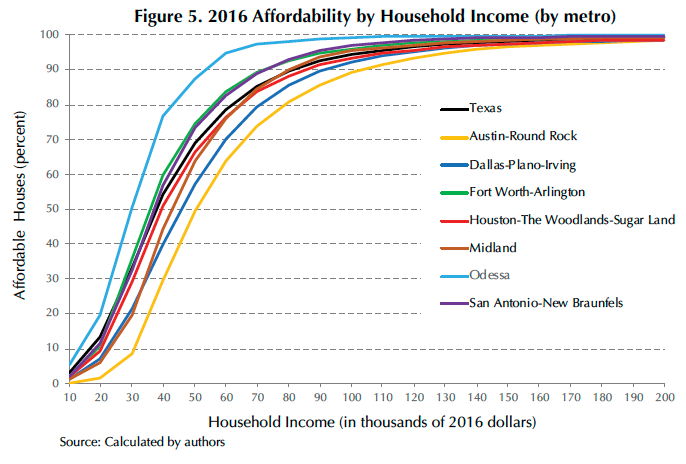
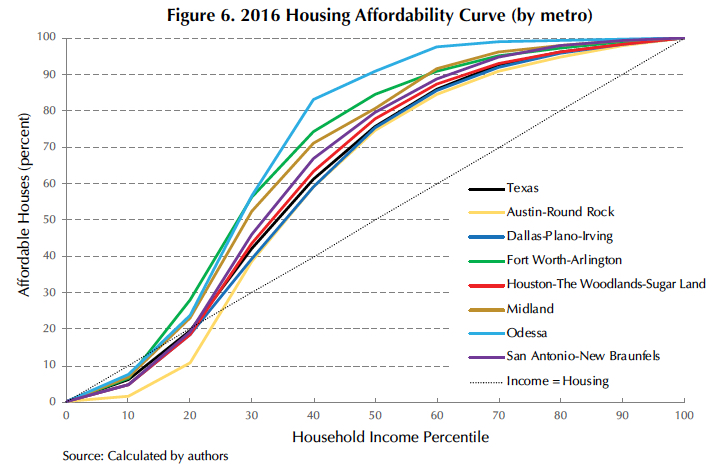
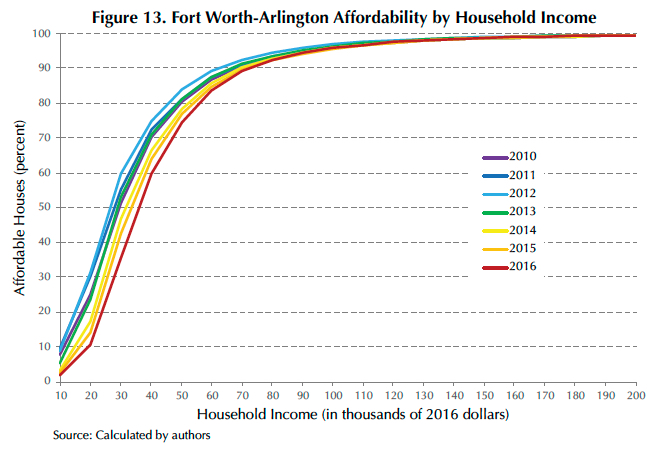
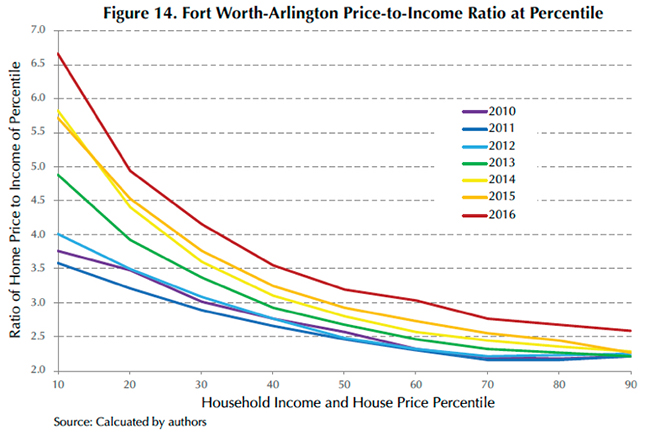
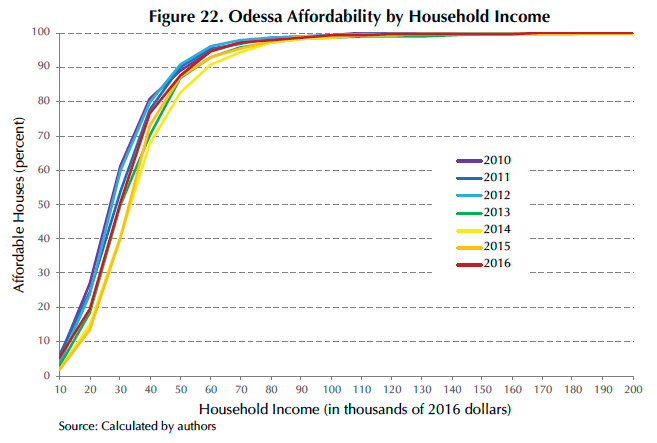
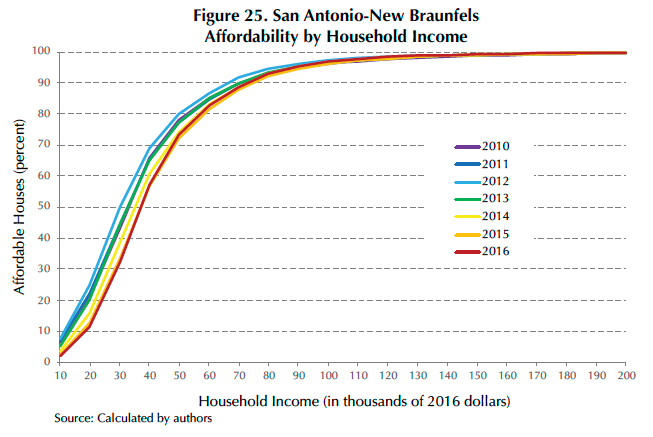
Applying this analysis to the major Texas metros and oil metros (Midland and Odessa) for 2016 (Figures 4 to 6), Fort Worth-Arlington’s and San Antonio-New Braunfels’ affordability measures outperformed the state. Affordability for Dallas-Plano-Irving and Houston-The Woodlands-Sugar Land was near or slightly below that of Texas. Austin-Round Rock was the least affordable among the “Texas Triangle" metros. While Austin-Round Rock had some of the highest income levels in the state, it also had the greatest affordability pressure due to higher housing costs.
Of the two oil metros, Odessa had the greatest affordability due to lower house prices and relatively high incomes from oil field activity. Midland affordability benefited mainly from having the highest income levels in the state; its housing prices were on par with the other major metros.

Keeping Texas Affordable
While Texas as a whole remains relatively affordable, certain markets have felt affordability pressure from home prices outpacing incomes and from the expectation of rising interest rates. Long-term changes in income and home price distributions have resulted in different affordability landscapes for various markets. Fewer affordable homes were available for households at the lower end of the income distribution than at the upper end.
These trends suggest continual erosion of affordability from the bottom of the income distribution up. To alleviate affordability pressure for potential lower-income homebuyers, incomes need to catch up with home prices and/or more entry-level housing needs to be built or return to the for-sale market from the rental market. Otherwise, Texas residents may be relegated to rental opportunities over home purchases.


____________________
Dr. Torres ([email protected]) is a research economist with the Real Estate Center at Texas A&M University and Wayne Day is a Ph.D. student in Texas A&M University’s College of Architecture.
You might also like

TG Magazine
Check out the latest issue of our flagship publication.