


Abilene has a younger population base than the state as a whole, and it heavily influences the local housing market, including rental homes. The market has been tightened by demand for affordable housing. |
Abilene’s housing market is at the end of a multiyear sales run. After bottoming out in 2011 from lingering effects of the Great Recession (GR), housing sales bounced back in a big way over the next couple of years and again between 2015 and 2017 (Figure 1). At the current rate, sales in 2019 should exceed 2018 but not by much. Activity has begun to cool, much like the local job market.

Employment, Household Growth Slowing
Employment growth in Abilene has been in step with the overall state trend throughout the decade except in magnitude. A few areas stand out. First, the 2014 oil downturn may have had a more drastic effect on Abilene jobs than on the state as a whole. In fact, a sharp decline in mid-2016 dipped the city into negative growth (Figure 2). Second, Abilene job growth began to diminish in 2018 as statewide job growth simply plateaued. Growth hasn’t gone negative, but it is tip-toeing near that boundary.

Abilene’s population growth has been strong, but growth in the number of individual households has not. The result has been an uptick in occupants per household, which for the area means growing birthrates and family sizes. This aligns with the growth trend of residents age 30–34, which has been the fastest growing age segment in Taylor County.
Along with these younger households, at least two other big groups (military personnel and college students) are competing for local affordable housing space. Demand from all three creates a tight market for not only affordable homes but also rental homes.
Young People Influencing Housing Market
As home sales activity has slowed, so has price growth. Growth based on repeat home sales reveals local price growth was more resistant than state price growth to downward price pressure during the GR (Figure 3). Abilene home price growth has been more level compared with the state’s runaway price acceleration, which is influenced heavily by the big four Texas metropolitan areas. By 2016, Texas price growth surpassed Abilene’s, and the spread between the two continues to expand.

The city has a larger-than-average 18-to-24-year-old population thanks largely to the presence of three four-year universities—Abilene Christian (ACU, the largest of the three), Hardin-Simmons, and McMurry. In 2017, over 13 percent of Abilene’s population was college age.
Total fall enrollment for the three universities began to decline in 2010 (Figure 4). The lowest point was 2014 with a combined enrollment of about 7,500, almost 1,100 fewer students than the peak total fall enrollment level set in 2009.

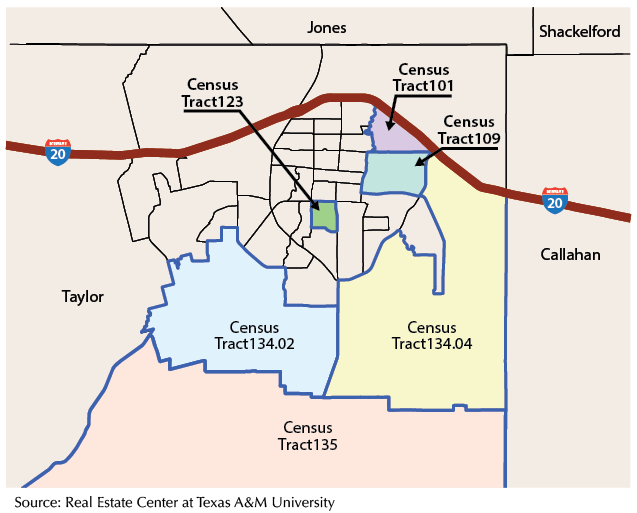
Census tract data from the U.S. Census Bureau (CB) estimate most undergraduate and graduate students reside in tracts within the loop near Abilene’s largest supply of affordable housing. The highest population density of students is in tracts that contain or are near a campus. These tracts show the most obvious swings in activity most aligned with enrollment trends (Figure 5).

Multiple Listing Service (MLS) home-leasing activity near McMurry (Census Tract 123) rose almost 50 percent since 2012. Activity between ACU and Hardin-Simmons (Census Tract 101) increased but not at the same rate. Both tracts are islands of households with the median age at 23 compared with the metro’s median of 34.
Home sales in these same tracts and Census Tract 109 show flattened growth, largely because of the diminishing inventory of homes on the market. The shrinking inventory of affordable homes could also explain why the share of renter-occupied housing units throughout the metro is growing. Homes in that price range may have been bought and repositioned as rentals.
Demand for rental homes also comes from nearby Dyess Air Force Base. Privatized housing located on base and inaccessible to the general population fulfills much of the military’s housing needs. However, according to CB tract data, dense pockets of military-employed households close to Dyess fill neighborhoods southwest of town.
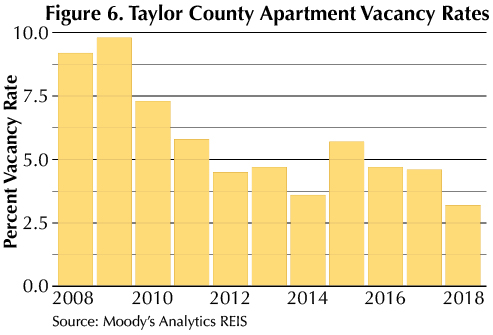
Tight housing demand has spilled over into the apartment market. Overall vacancy fell to the area’s lowest levels up until 2015 when a new apartment complex in south Abilene relieved the market (Figure 6). Since then, vacancy has gotten back on track and continued to decline.
South Abilene Growth
Much of Abilene’s home sales growth is to the south of town outside the loop. Homes there are typically newer, larger, and more expensive. In addition, the two highest-rated school districts—Wylie ISD and Jim Ned CISD—are nearby.
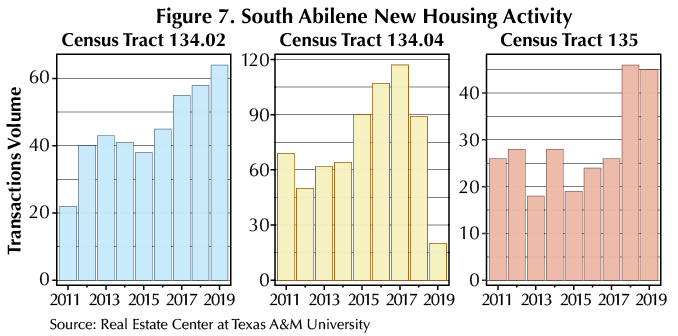
Activity for new homes sold through the MLS shows rapid growth in new construction sales volume since 2011, with Census Tract 134.04 in outer southeast Abilene leading the way for most of the decade (Figure 7). Volume in this tract peaked in 2017 and had little activity in 2019 as of August of that year. In its place, new home sale activity to the southwest between Abilene and Buffalo Gap continues to grow exponentially.
Taylor County building permits suggest new residential home activity has been in high gear for more than five years. As of August 2019, year-to-date permit levels are set to exceed 2018’s total.
For the time being, the supply of new homes is being absorbed by the market at a steady pace. Months inventory of new homes sold through the MLS more than doubled in 2018 when a wave of new-home listings entered the market, but 2019 sales are on pace to exceed 2018’s record-setting volume.
The outer south end of Abilene has one of the highest child-dependency ratios in the county. This CB statistic measures the ratio of children younger than 18 to adults age 18 to 64. For the entire metro, the ratio is approximately 39 kids for every 100 adults, but in south Abilene it’s closer to 60 per 100. This helps explain why Wylie ISD enrollment has grown on average 3.8 percent each year.
In addition, Abilene is the largest city of its size between Dallas and Midland. It’s the urban center for surrounding counties, and the south end of Abilene benefits when those counties grow.
For example, adjacent Nolan County (which is not within the Abilene Metropolitan Statistical Area) has experienced a tremendous amount of growth and notoriety for its high density of wind turbines. In fact, in the entire nation only two California counties have more wind turbines than Nolan County. Sweetwater is the Nolan County seat, but an independent housing analysis sponsored by the city found Abilene is where residents choose to live because of better schools and more plentiful, newer housing stock, particularly to the south of town.
____________________
Roberson ([email protected]) is a senior data analyst with the Real Estate Center at Texas A&M University.
You might also like

TG Magazine
Check out the latest issue of our flagship publication.