


Small Cities, Big Opportunities

With significantly fewer people than larger metros, Texas’ Micropolitan Statistical Areas have smaller economies driven by a handful of dominant industries. Some benefit from their close proximity to larger urbanized metros, which can provide additional economic opportunities and attract certain demographic groups, such as retirees. |
Micropolitan Statistical Areas (micros), the smaller siblings of Metropolitan Statistical Areas (metros), are a demographic category developed to analyze urbanized communities with populations of 10,000 to 50,000. They are defined by the Office of Management and Budget (OMB) and tracked by the U.S. Census Bureau. Some micros could be seen as the next emerging metros.
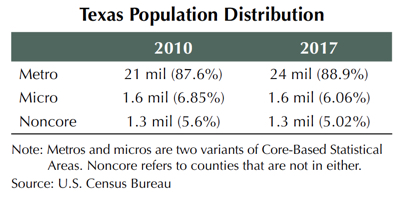
Texas has almost twice as many micros as it does metros. In 2017, around 6.1 percent of the state’s population lived within a micro area (see table), down from 2010. Meanwhile, metro population growth has continued to expand. With so much growth in the metros, what kind of growth prospects are there for the micro housing markets?
Micro Market Movers
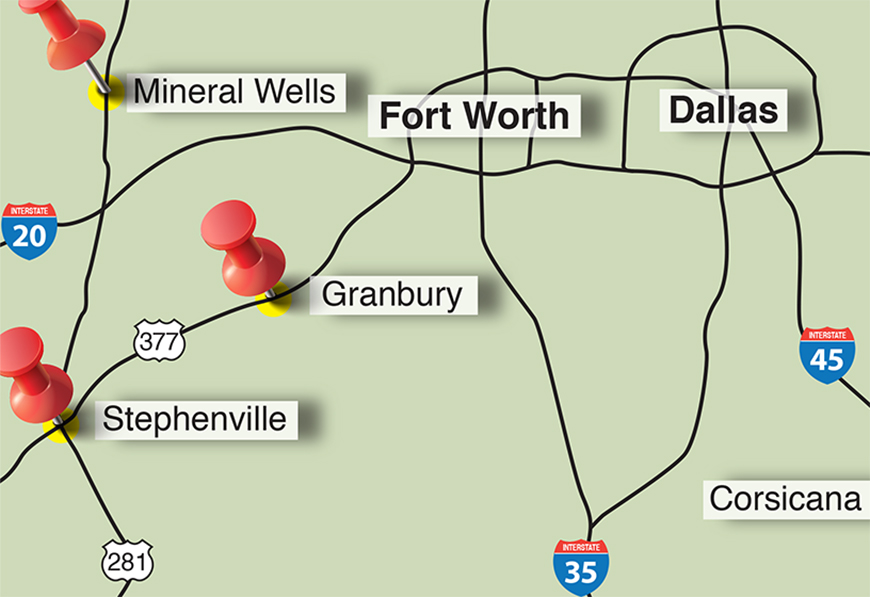
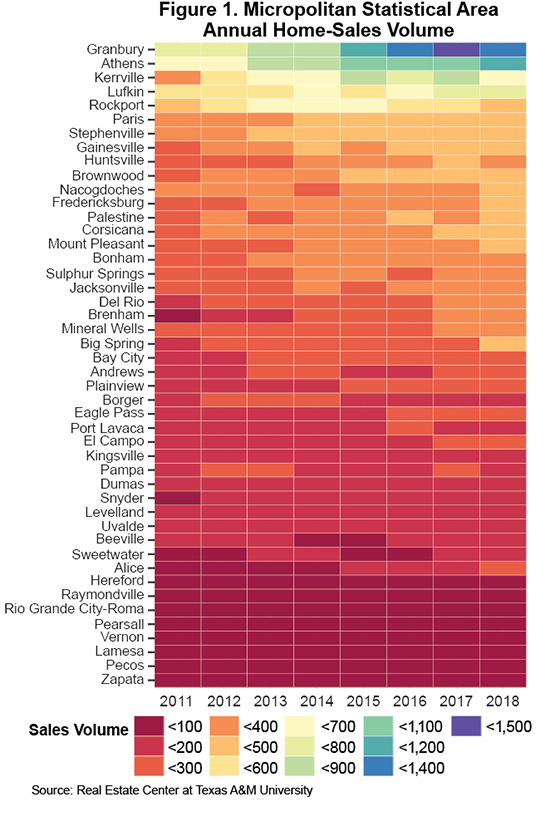
Housing activity within micro markets varies considerably. Over the past eight years, some Texas micros have experienced a tremendous amount of housing sales growth while others have had almost none at all (Figure 1). They can benefit in a number of ways from being near much larger metros. For example, Athens and Granbury, which are both adjacent to Dallas-Fort Worth (DFW), have seen strong growth in home sales. Like those cities, many of the other top micros are in or near the “Texas Triangle" (the area between the state’s largest metros).
Economic opportunity is another benefit of metro proximity. The amount of opportunity, or the lack thereof, can have a visible snowball effect on micro dynamics at numerous levels. Areas with sustained employment growth tend to have sustained population growth, which leads to housing demand.
Between 2011 and 2017, most micros with positive population and employment growth were close to the Texas Triangle (Figure 2), with only a few exceptions. Micros with negative population and/or employment growth are often more remote.

Although there are some indications that micros nationally have become more economically diverse, many Texas micros still rely on only a handful of industries. This can be a sign of potential job growth volatility or even stagnation. Employment patterns in these markets often spill over into housing trends.
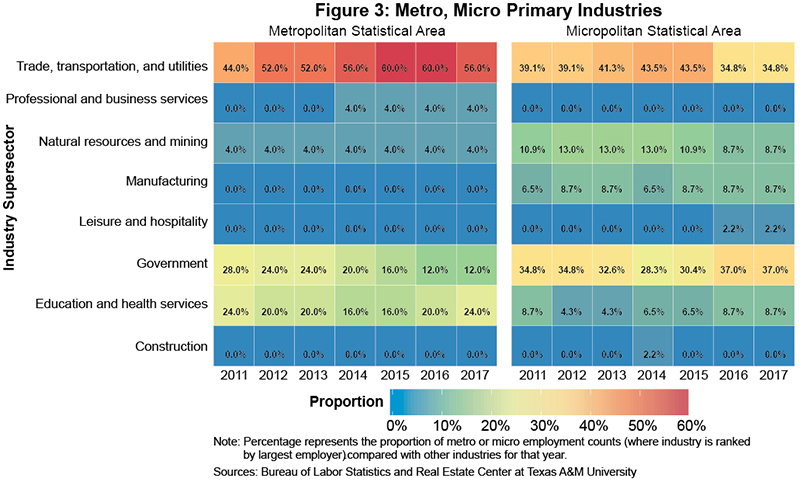
Since 2011, the labor force in almost 10 percent of micros has been predominantly employed in either natural resource and mining (most likely from oil and gas production and distribution) or manufacturing (Figure 3). The former provides an economic outlet for some of the more remote micros but creates an obvious dependency on economic growth.
Government is a major source of employment for almost a third of Texas’ micros, higher than the proportion taken by metros. Most of these jobs are with local municipalities, school districts, and/or county seats with employment levels that do not fluctuate much year to year. Local government is a support industry and not an economic driver, so its dominance as an employer could point to a lack of economic growth opportunities.
Meanwhile, metros have a higher proportion of education and health services jobs, signifying more higher education and healthcare options than micros. Both sectors, but especially healthcare, are major influences for specific population groups.
The trade, transportation, and utilities industry is a broad group typically dominated by the retail sector. Metros have the upper hand with more shopping outlet options providing a larger general employment base compared with micros.
Growth Comes in Different Forms
A handful of micros stand out as examples of major employment and population growth. At one extreme are Andrews, Pearsall, and Pecos, where oil and natural gas plays have caused lopsided local employment and population growth (Figure 2). Housing grew tremendously during oil’s rise but plummeted when the cycle ended.
Granbury has had more sustained growth than Andrews, Pearsall, and Pecos since the start of the decade, benefiting from being close to DFW as well as from gas exploration in the Barnett Shale during the early 2000s. Considering Granbury’s much larger size, growth numbers for those other three cities are all the more impressive.
Household growth in Granbury has increased demand for housing and placed upward pressure on prices. In 2017, home sales approached 1,500, placing the city above all other micros in housing activity.
The story goes a little differently for Athens, the second largest housing micro market. The number of households there has not grown much over the years. In fact, the Census Bureau estimates household count within the principal city of Athens may have fallen. The unemployment rate has fallen in Henderson County, where Athens resides, but so has the overall labor force. Additionally, since 2010 the ratio of those working to the overall population has shrunk, altering the interpretation of the area’s unemployment rate.
Despite Athens’ employment trends, the economy is still growing but in a different form. Since earlier in the decade, per capita income has typically grown around 3 percent or less. This includes earnings for work performed. Retirement and passive income, however, have grown at a much faster pace.
Most home sale growth in Henderson County is along Cedar Creek Reservoir, a major recreational lake, with either Gun Barrel City or Mabank competing for top annual sales (Figure 4).
According to Census Bureau migration data, Dallas County ranks among the highest sources of inflow migration to Henderson County. Henderson County’s fastest growing age segment is 65-to-74-year-olds. This means the housing boom is likely from a surge of retirees coming from DFW.

Leisure and Retirement Growth
Employment growth is not the only bellwether for housing growth. Several micros—including Brenham, Kerrville, Fredericksburg, and Rockport—exhibit housing growth due to more recreational reasons. While not identical, each of these cities has carved a niche drawing in people interested heavily in lifestyle.
Fredericksburg and Athens have similar demographic trends. Growth in each city’s retirement-aged population and per capita retirement income is on the rise, and both housing markets are among the most active of all micros. However, Fredericksburg’s most impressive growth is in its escalating home prices (Figure 5). Since 2000, the city’s price growth has matched or exceeded many of the big Texas metros.

Expansion in the leisure and hospitality (L&H) industry has had a major effect on Fredericksburg housing in the Airbnb era. Typically one of the largest job sectors in the area, in 2016 L&H went from the third largest industry by number employed to second largest. This had a positive economic impact on Fredericksburg thanks to the rapid increase in passive income (for example, rents, dividends, and interest) per capita. In fact, it has the largest per capita passive income level of all Texas metros and micros by a growing margin. Of the four other top cities, three are micros and only one, Midland, is a metro (Figure 6). In light of Midland’s current housing boom, passive income could be from rents but is more likely from oil payments.

The L&H industry’s high job contribution is a common thread among three of these micro markets. Kerrville has a smaller proportion of L&H jobs but has an industry level still much higher than other micros. In Rockport, over 40 percent of jobs in 2017 and 2018 were in L&H, which is partly why job levels there plummeted after Hurricane Harvey and are still recovering.
Brenham’s high passive income per capita rates are not due to tourism. Instead, its economy is heavily influenced by production of one of the state’s tastiest exports, Blue Bell Ice Cream. The 2015 listeria crisis, which resulted in approximately 10 percent of Brenham’s labor force being either furloughed or laid off, was a major setback for the local economy. Per capita personal income and employment levels are still recovering.
Brenham’s high passive income rates could be from retirement-aged homeowners migrating from metros, particularly from Houston. This would explain Brenham’s growing retirement-aged community and the amount of retirement income flowing to the area. It could also mean that, like Midland, the high passive income could be from sources besides rents.
Smaller Populations, Smaller Economies, Different Relationships
Texas micros have smaller populations, which means smaller economies and/or fewer socio-economic groups. These features can change the typical relationship between economic growth, population growth, and housing growth.
Smaller economies often come with a handful of dominant industries that can directly shape housing trends. At the same time, growth in specific groups, such as retirement-aged citizens, can provide housing growth outside the local base economy. Finally, close proximity to highly urbanized metros can expand a city’s economic opportunities and attract new residents.
____________________
Roberson ([email protected]) is a senior data analyst with the Real Estate Center at Texas A&M University.
You might also like

TG Magazine
Check out the latest issue of our flagship publication.