


Home Delivery


New-home inventories in Texas have averaged 4.8 months since 2012, well below the six- to 6.5-month equilibrium level. Rising land prices and lagging labor productivity prevented a sufficient supply-side response following the Great Recession. |
Since the turn of the 21st century, the Texas economic model has attracted significant national attention. While the U.S. economy collapsed during the Great Recession (GR), Texas escaped most of the damage and thrived after the shale oil boom in 2011. Housing affordability was critical to the state’s success but is quickly diminishing, the result of rapid home price increases and sluggish income growth. Periods of income stagnation are not uncommon, occurring in every decade since 1950, and are generally allayed by improved technology and labor productivity. The current rate of home price growth, however, exceeds historical comparison, including the oil boom era of the 1970s.
The heart of the affordability problem lies in the single-family market, where analyses are typically bifurcated into new- and existing-home categories. While existing homes constitute a majority of sales activity, new-home trends provide useful forward-looking information. After all, every new house enters the resale stock at some point following its initial transaction. The inherent singularities of the new-home market, combined with today’s extreme price growth, warrant a deeper examination.
Prices Soar and Sales Activity Shifts
From 2003 to 2017, the median price for new single-family homes sold through Texas Multiple Listing Services rose 70 percent. These gains, however, were not because homes were bigger. The median square footage for new homes actually decreased 4 percent during the period, pushing the median price per square foot up 62 percent and discounting the explanation of larger homes driving up the median price.
Not only did home prices increase, but the statewide sales distribution transformed. In 2003, sales of new homes were highly concentrated around $145,000, where more than 40 percent of final transactions occurred within a $60,000 interval (Figure 1). By 2017, peak activity shifted toward $220,000 and dispersed significantly, flattening the top of the distribution and widening its tails. As a result, less than a quarter of new-home sales occurred between $190,000 and $250,000 (a comparable $60,000 interval). The thickened distribution, particularly toward higher price ranges, suggests that median and average price metrics insufficiently capture the magnitude of price increases in the market.

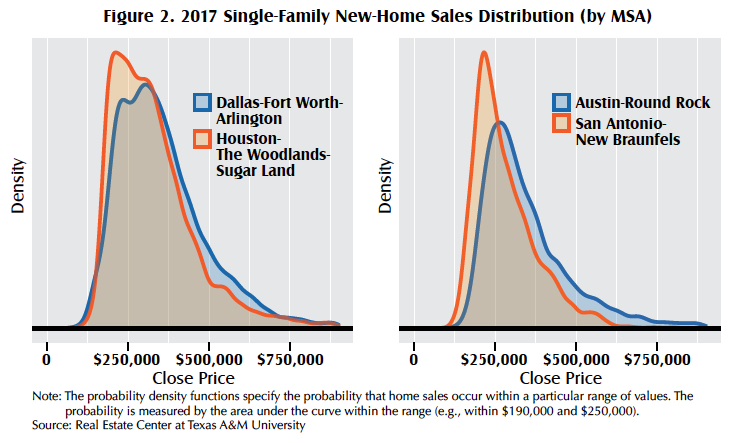
Housing market deviations in the major Metropolitan Statistical Areas (MSA) drove the distributional shift. In 2003, new-home sales in the major MSAs concentrated uniformly around $145,000. By 2017, bimodal distributions developed in the Dallas and Houston MSAs, while Austin and San Antonio maintained a single predominant peak (Figure 2). Diverging prices in the Dallas and Fort Worth Metropolitan Divisions produced North Texas’ double-pointed distribution. During those 14 years, the premium paid at the median level for new homes in Dallas over Fort Worth jumped from $20,000 to $55,000. An analogous shift occurred in Houston as higher-end residential development gravitated north of downtown.
Despite regional price variations, home prices soared in 2011 as the shale oil boom propelled the Texas economy out of the GR. It took less than a year to reduce new-home surpluses that had accrued during the downturn. The economy flourished for four years, igniting housing demand without an adequate supply-side response, forcing prices upward.
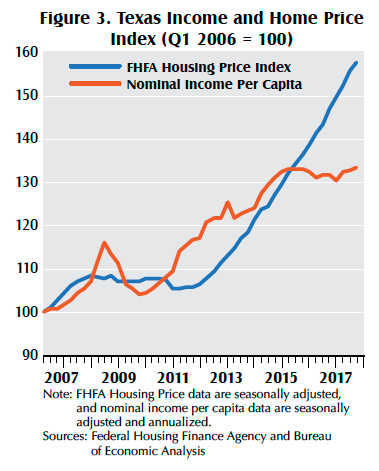
Texas’ per capita income kept pace with soaring home prices until the oil bust at the end of 2014 (Figure 3). While averting a full-blown recession, the economy staggered and has yet to reach a complete growth recovery. The cyclical slowdown did, however, shock Texas income levels. Through 2017, real per capita income remained 3 percent below its previous peak. On the other hand, the oil bust hardly disrupted the statewide housing market, allowing prices to climb even higher. The confluence of idle incomes and rising home prices challenged Texas’ famed affordability.
Sluggish Supply-Side Response
Since 2012, new-home inventories have persisted below the six- to 6.5-month equilibrium level, averaging just 4.8 months. Robust demand contributed to the shortage, but depressed single-family construction activity generated most of the imbalance. In 2017, Texas issued 110,647 single-family building permits, still 29 percent below 2006 levels. After adjusting for population growth, permits remained a dismal 42 percent behind their prerecession peak.
Rapid price increases resulting from restricted supply summarizes the myriad of challenges facing the homebuilding industry. Texas has a housing shortage but particularly a shortage of homes under $300,000. Rising supply-side costs squeezed profit margins, forcing builders to shift construction to higher price cohorts. As a result, the months of inventory for homes priced above $500,000 has doubled that of homes priced below that mark over the past seven years.
Land Prices Spill into Housing
Rising land prices provoked substantial increases in home construction costs. Over the past 20 years, the proportion of sale price attributed to land cost has increased five-fold from less than 5 percent to 20 percent in Texas. The land share was even higher in the largest MSAs, representing more than a quarter of the sale price in Dallas and Houston (Austin data do not exist). Anecdotally, land prices sometimes constitute the entire purchase value. For example, during gentrification periods some existing homes are purchased and immediately cleared for the construction of new homes. In this case, not only does land account for the total purchase value but also the cost of demolition.
In the past two decades, rural land values inflated significantly across Texas. As expected, prices dropped during the downturn, but explosive growth returned with the oil boom. Between 2012 and 2017, the price per acre spiked 33 percent. Rising rural prices spilled into urban areas through competition between various residential and nonresidential land uses. As the population expands, suburban developments and peripheral businesses desire an increasing amount of former farmland (or land previously used rurally). The massive gains in rural land prices, combined with a larger proportional land cost, reflect the transformed supply structure confronting Texas homebuilders.
Regulations and red tape contributed to the land-cost burden, too. Stricter building codes and zoning restrictions, while sometimes necessary, distort the market and pressure prices upward. The current regulatory environment is poised to expand. For example, local governments along the Gulf Coast are considering updating flood plain and building requirements after consecutive years of destructive storms.
Additionally, financial regulations have hindered smaller developers who could supplement the constrained supply. In 2017, the total loan volume for Texas land development was less than three-quarters of the 2007 level. Given the state’s prolonged economic expansion and housing shortage, one would expect a hyperactive residential construction credit market. On the contrary, securing debt remains increasingly difficult, thereby heightening the supply-side constraint.
Commodity Prices Recover and Rise
In terms of the actual housing structure, softwood lumber used in framing accounts for 15 percent of the total building cost. Softwood prices soared in the 1990s amid trade disputes with Canada and domestic supply restrictions for environmental protection. The housing crisis slammed lumber prices down 30 percent between 2004 and 2009 as demand dwindled (Figure 4). Prices recovered for five years before falling back after the expiration of quotas and tariffs on Canadian softwood in 2015. The dispute renewed in 2017 with the U.S. government’s imposition of a 20 percent average import duty on Canadian softwood. Combined with domestic housing shortages, this shock sent prices soaring to historic highs, further straining the homebuilding industry.
Behind framing, foundation-related activities accounted for 11 percent of building costs. Cement and concrete are the primary physical inputs used for foundations. These commodities exhibited less volatility than lumber, holding firm during the GR and rising constantly afterward. Cement and concrete prices jumped 56 percent from 2004 to 2017. Foundation cost also includes excavation and backfill processes, requiring workers with machine-operation skills and experience. Recent wage increases further inflated construction costs, squeezing profit margins and elevating home prices.

Wage and Productivity Slack
The headline complaint from the homebuilding industry is the lack of skilled labor. Developers claim to constantly compete for specialized workers whose skilled crafts are disappearing in today’s technology-centered society. In response, homebuilders plead to expand guest-worker programs to satisfy the domestic labor shortage. Increasing the labor supply should be an obvious solution to relieve price pressure, but the data suggest a more complicated phenomenon.
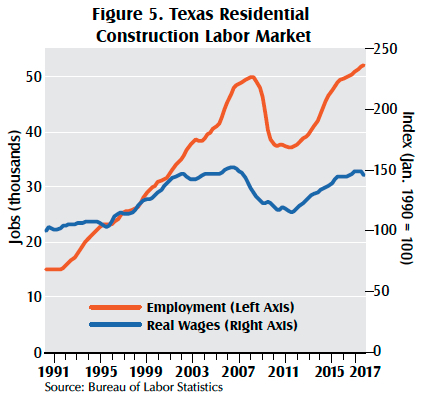
Texas residential construction employment suffered disproportionately during the housing crisis, crashing 26 percent between first quarter 2008 and first quarter 2010 (Figure 5). The industry had a drudgingly slow recovery and failed to recoup peak levels until 2016. Since then, employment has expanded steadily, surpassing 52,000 total jobs in third quarter 2017.
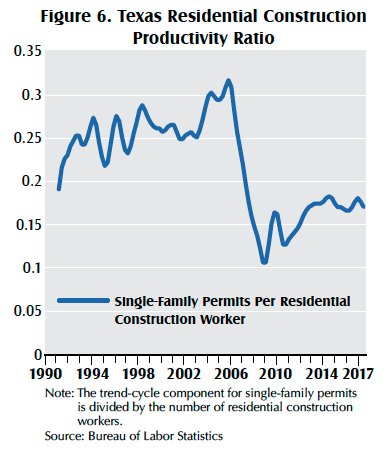
The record number of industry jobs coincides with sluggish single-family construction activity. In 2017, the number of single-family permits issued per residential construction worker (Figure 6) was 32 percent below its prerecession average. In other words, before the recession there were less than four residential construction jobs per single-family permit in Texas. Today’s industry requires six jobs per permit. These values may appear trivial, but when aggregated across the state they explain residential construction’s underlying productivity issues.
Residential construction workers encompass both single- and multifamily industries, potentially distorting sector-specific productivity variations. Detailed data at the national level, specifically for single-family general contractors, mirrored the stagnant productivity trend. While the entire economy has been concerned with boosting productivity, the construction industry has been notoriously unimaginative. The industry’s inefficiencies are illustrated not only by weak productivity growth but by lagging wages.
Real residential construction wages have yet to recover from the housing crisis despite claims of labor constraints (Figure 5). These wages jumped 27 percent between third quarter 2011 and third quarter 2017, but this growth represents merely a recovery after an even larger collapse. Furthermore, residential construction wages have not kept pace with other goods-producing industries, such as mining and manufacturing, even after the energy downturn in late 2014. These trends suggest builders aren’t competing for labor as drastically as claimed, restraining wages below their previous peak. While homebuilders are certainly struggling to produce lower-priced housing, a skilled-labor shortage is far from the full story.
Supply-Side Struggles Challenge Economic Capacity
Despite waning housing affordability, Texas conditions remain favorable compared with other states. Texas is consistently one of the largest recipients of domestic migrants (U.S. citizens moving from another state), who often originate from higher-cost states such as California and Florida. In 2017, domestic migration sunk to its lowest level since 2005, portending decreased relative advantages. Some of this change resulted from overall economic improvements in other states and the nation. Americans observed Texas’ resilience during and after the GR, while most states struggled with major economic losses. Those states have begun to catch up, thereby weakening Texas’ relative appeal.
The Lone Star State continues to have steady job growth, benefitting from a variety of natural resource endowments, global trade access, and a pro-business tax environment. Texas boasts massive amounts of land, allowing practically unlimited population growth. Of course, population follows employment, which is increasingly found in urban areas.
Although Texas is not geographically constrained like California, New York, and Florida, it is experiencing similar housing market trends, albeit to a lesser degree. Economic growth is strengthening regional housing demand, particularly around major job centers. Homebuilders are struggling to keep pace, even compared with production levels reached last decade. The outlook is bleaker for homes priced under $300,000, where demand is strongest.
Increased regulations, building restrictions, and input prices have forced builders away from the bulk of housing demand. Lumber and labor, however, are not the primary cause of the market imbalance as prices are nearly identical to last decade. The decrease in labor productivity in residential construction is a primary concern. The data suggest it takes more workers to build a house today than it did in 2007. In addition, the shortage of skilled labor (for example, plumbers and electricians) is lengthening the time it takes to build a house, adding to the cost. Unless these issues are addressed, Texas’ housing affordability will decline further and hinder future economic growth and prosperity.
____________________
Dr. Torres ([email protected]) is a research economist and Miller ([email protected]) a research associate with the Real Estate Center at Texas A&M University.
You might also like

TG Magazine
Check out the latest issue of our flagship publication.