


All the Right Moves


The Takeaway Local residential and commercial markets are directly impacted when residents move. Center research shows that, on average, Texas has a higher rate of movers—and more from abroad—than the U.S., and more people move to Texas from other states than vice versa. |
People moving from one location to another directly affects real estate markets. In residential markets, movement to an area results in more housing units purchased or rented while moving out means more are available for sale or rent. Population changes in an area also affect demand for goods and services. This impacts commercial real estate markets (retail and offices, for example) and service-providing industries, such as moving and insurance companies.
The Real Estate Center at Texas A&M University researches and monitors household movements in Texas. Recent research finds that:
- Texas’ average geographical mobility rate is higher than the U.S. average;
- more people move to Texas from other states than leave for other states;
- Texas has higher rates of movers from abroad than does the U.S.; and
- mobility in both Texas and the U.S. fell in the Great Recession (GR) and has not yet returned to pre-GR levels.

Texas Geographic Mobility
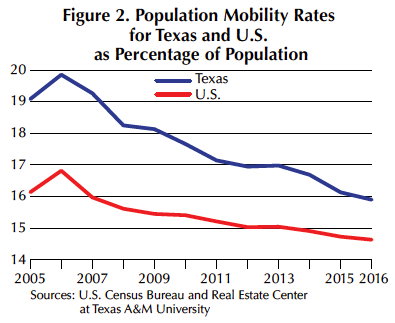
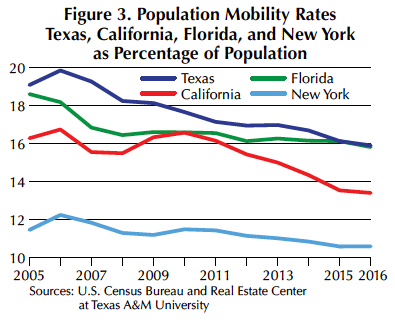
In 2016, more than 4.3 million people in Texas changed residences, accounting for 15.9 percent of the state’s population one year and older, compared with 14.6 percent nationwide (Table 1). Texas had the highest mobility of the most populous states, followed by Florida (15.8 percent), California (13.4 percent), and New York (10.6 percent). In both the U.S. and Texas, the numbers of movers fell in the GR after peaking in 2006 and have not yet recovered their pre-GR peaks (Figure 1). As a percentage of population one year and older, the Texas population mobility rate peaked at 19.9 percent in 2006. Since then, it has trended downward but remained above rates for the U.S., California, New York, and Florida (Figures 2 and 3).


Intrastate movers (movers within a state) are the largest group of movers, accounting for 82.4 percent of movers in Texas in 2016 (Figure 4). In both Texas and the U.S., intrastate mover rates peaked in 2010 and have trended downward since. However, Texas’ intrastate mobility rates have remained higher than national averages.

In 2016, 5.8 percent of the Texas population moved within the same city or town, compared with 4.4 percent for the U.S. (Table 1 and Figure 5). In both Texas and the U.S., the same city/town moving rates have trended downward since 2009, but Texas’ rates have remained higher than national averages (Figure 5).

More than half a million people moved to Texas from other states in 2016 (Table 1). Movers from other states accounted for 13.8 percent of total Texas movers in 2006 before the GR, falling to 11.1 percent in 2010, and trending upward to 12.2 percent in 2016 (Figure 6). Since 2005, rates of in-migrants from other states as percentages of total movers have been close to the corresponding rates for New York, higher than California rates, but lower than Florida rates (Figure 6). As a percentage of the Texas population, the in-migrant rate to Texas trended downward from 2.7 percent in 2006 to 1.9 percent in 2016 (Figure 7). Since 2005, Texas’ rates have been lower than Florida’s rates but higher than the corresponding rates for New York and California (Figure 7).


Texas draws more movers from other countries, Puerto Rico, and U.S. islands than the U.S. does. These movers accounted for 0.9 percent of Texas’ population in 2016 compared with 0.7 percent for the U.S. (Table 1 and Figure 8). International migration rates for both the state and the nation trended downward in the GR, then upward after the recovery.

Texas mobility also includes those leaving Texas and moving to other states or countries. In 2015, 445,925 moved from Texas to other states and Puerto Rico. As a percentage of the state’s population, out-migrants accounted for 2 percent in 2006, then trended downward in the GR to 1.6 percent in 2015 (Figure 9). Data for Texans who moved to other countries are not available because Census surveys are administered only in the U.S.
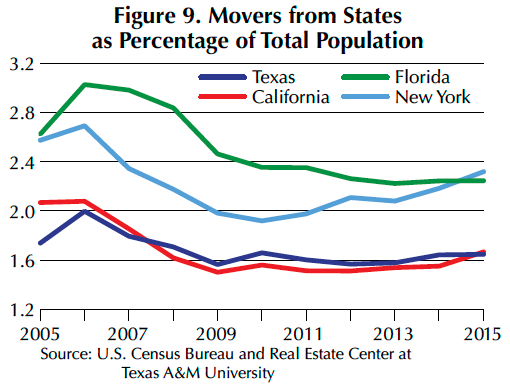
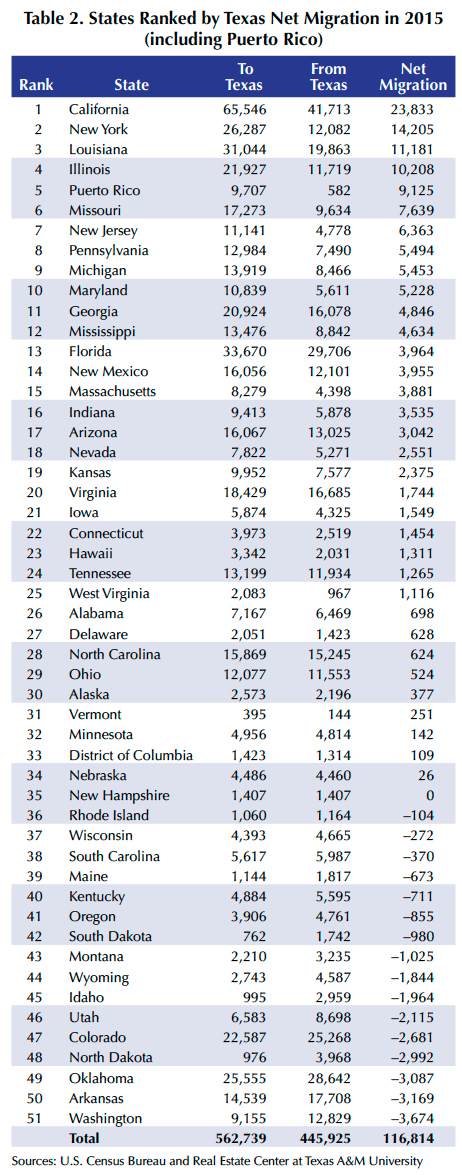
Table 2 shows the number of movers to and from Texas in 2015 and net movers (movers to Texas minus movers from Texas). There were 65,546 movers from California to Texas and 41,713 movers from Texas to California, ranking the Golden State first in Texas net migration with positive 23,833 net movers. New York, Louisiana, and Illinois were next. Texas had negative net migration with sixteen states including Washington, Arkansas, Oklahoma, North Dakota, and Colorado.
Mobility in Texas Metropolitan Areas
The most recent moving data available for Texas metropolitan areas are annual averages for 2011–15 (Table 3). College Station-Bryan ranked first in number of movers as a percentage of the population followed by Lubbock, Abilene, Killeen-Temple, San Angelo, and Austin-Round Rock. Brownsville-Harlingen had the lowest mobility rate followed by McAllen-Edinburg-Mission, Laredo, Beaumont-Port Arthur, and El Paso. Dallas-Fort Worth-Arlington had the largest absolute number of movers followed by Houston-The Woodlands-Sugar Land, San Antonio-New Braunfels, Austin-Round Rock, and El Paso.

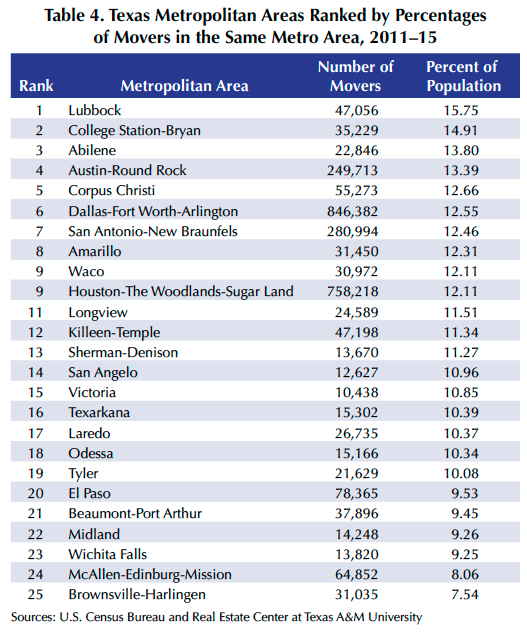
Lubbock ranked first in percentage of movers within the same metro area followed by College Station-Bryan, Abilene, Austin-Round Rock, Corpus Christi, Dallas-Fort Worth-Arlington, and San Antonio-New Braunfels (Table 4). Brownsville-Harlingen had the lowest percentage followed by McAllen-Edinburg-Mission, Wichita Falls, Midland, and Beaumont-Port Arthur.
College Station-Bryan ranked first in percentage of movers from different metropolitan areas (including those outside Texas) followed by Killeen-Temple, San Angelo, Midland, and Lubbock (Table 5). Laredo ranked last followed by Brownsville-Harlingen, McAllen-Edinburg-Mission, Amarillo, Houston-The Woodlands-Sugar Land, and Dallas-Fort Worth-Arlington.

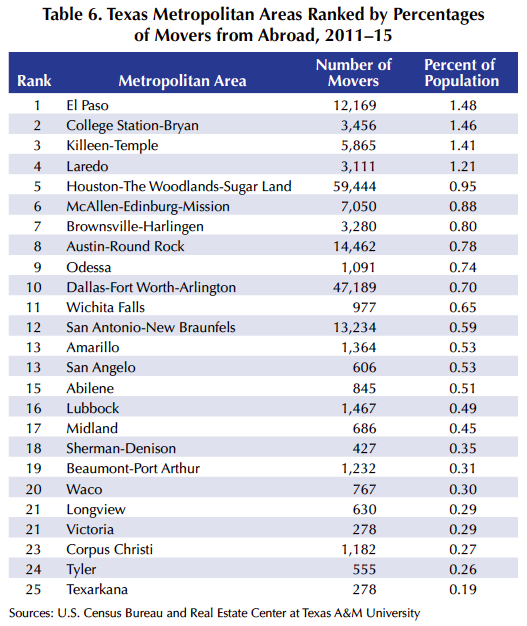
El Paso ranked first in percentage of movers from abroad followed by College Station-Bryan, Killeen-Temple, Laredo, and Houston-The Woodlands-Sugar Land (Table 6). Texarkana had the lowest rate followed by Tyler, Corpus Christi, Victoria, Longview, and Waco.
____________________
Dr. Anari ([email protected]) is a research economist with the Real Estate Center at Texas A&M University.
You might also like

TG Magazine
Check out the latest issue of our flagship publication.