


Still Affordable


Housing affordability for both Texas and the U.S. has declined since the end of 2012. Texas remains more affordable than the nation; however, affordability in some of the state’s major metros is weakening. |
The widening gap between home price and household income has recently sparked concerns over housing affordability. The majority of homebuyers depend on mortgage debt financing to purchase a home and must earn sufficient incomes to qualify for a loan. While affordability has decreased for both the nation and the state since the end of the housing crash, Texas and its major metro areas remain affordable to most homebuyers.
Calculating Affordability
Housing affordability indexes measure the ability of a family (or household) earning the median family (or household) income to qualify for the median-priced home, given a set of financing assumptions. The Real Estate Center’s Texas Housing Affordability Index (THAI) calculates housing affordability for families, as opposed to households, using income figures from the Department of Housing and Urban Development and the Federal Financial Institutions Examination Council. The index covers the nation, the state, each MSA, and selected counties.
The THAI is the ratio of median family income to the required income to qualify for a mortgage loan. Required qualifying income is a function of the required monthly mortgage payment and the lender-stipulated qualifying ratio (required qualifying income = required monthly payment/qualifying ratio × 12). The required monthly payment is based on an 80 percent, 30-year mortgage for the median-priced home at the effective mortgage interest rate obtained from the Federal Housing Finance Agency. The qualifying ratio is the lender’s stipulated ratio of the monthly mortgage payment to monthly income.
The THAI qualifying ratio of 25 percent indicates the monthly mortgage payment cannot exceed 25 percent of the borrower’s monthly income. Because the index does not account for homeownership costs other than mortgage principal and interest, it uses a lower qualifying ratio than might be applied to monthly housing costs. If additional costs of homeownership, such as taxes, insurance, and utilities were included, the lender-stipulated qualifying ratio would increase, typically to around 35 or 40 percent or more.
A THAI index value of 1.00 means the required income to qualify for the median-priced home is equal to the median family income. When the required qualifying income exceeds median family income, the index value falls below 1.00. This indicates that a family earning the median income would not qualify for the median-priced home. When the required qualifying income falls below median family income, the index value exceeds 1.00. This means that a family earning the median income would qualify for the median-priced home (Table 1).

By assuming a 20 percent down payment, the index likely overestimates actual affordability. Government-created home finance programs allow homebuyers, particularly first-time homebuyers, to purchase a home with a reduced down payment. For example, the minimum down payment for a Federal Housing Administration (FHA) loan is 3.5 percent. A lower down payment increases the required monthly payment, which consequently results in a higher required qualifying income.
For example, to purchase a $150,000 home with an 80 percent, 30-year loan at 4.25 percent, the monthly mortgage payment would be $590.33, and the required qualifying income would be $28,336. To purchase the same home with a 96.5 percent loan, the monthly mortgage payment and required qualifying income would increase to $712.08 and $34,180. In other words, a higher required qualifying income relative to median family income decreases housing affordability.
Table 2 demonstrates the increase in the required qualifying income as the down payment decreases. In 2016, a family needed to earn $50,406 to qualify for an 80 percent loan, $56,707 to qualify for a 90 percent loan, $59,857 to qualify for a 95 percent loan, and $60,803 to qualify for a 96.5 percent loan in the Austin-Round Rock MSA. The median family income is $77,800. The lower the down payment, the closer the required qualifying income to the median family income. All calculations assume a 30-year loan at the effective mortgage interest rate and a 25 percent qualifying ratio.
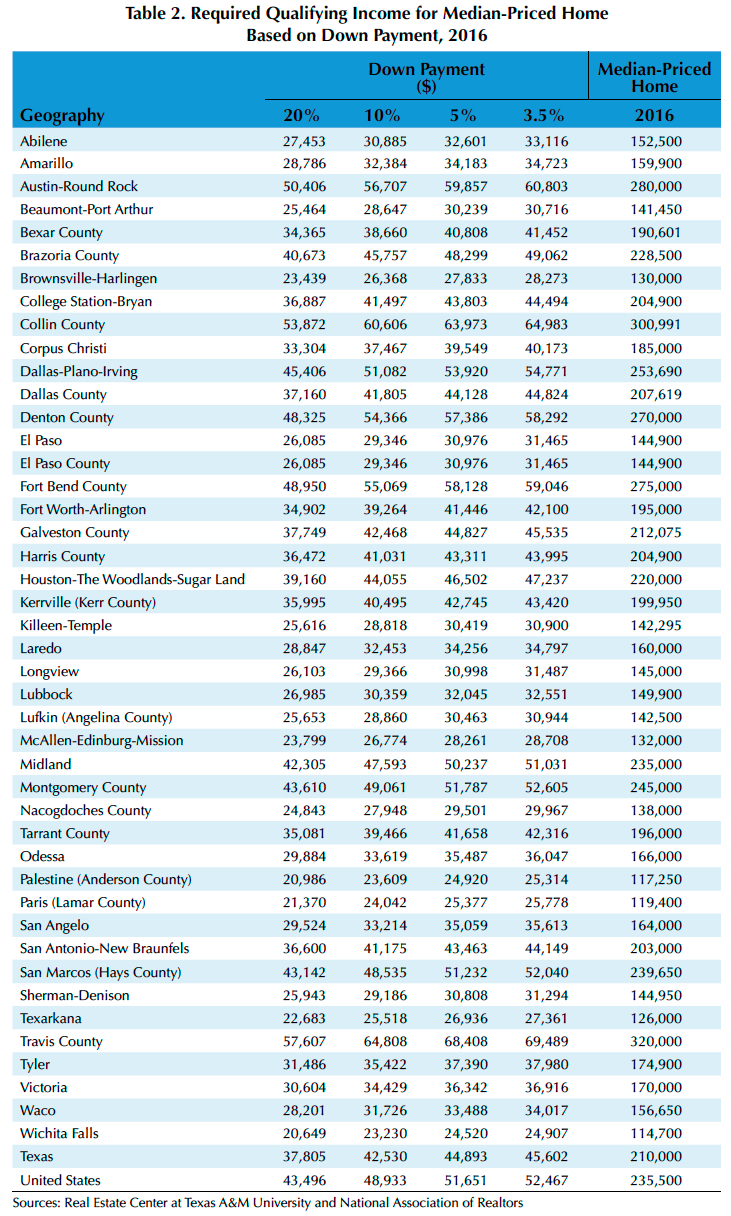
A 10 percentage point decline in the down payment (from 20 to 10 percent) results in a 12.5 percent increase in the required qualifying income. A 5 percentage point decline in the down payment (from 10 to 5 percent) results in a 5.6 percent increase in the required qualifying income, while a 1.5 percentage point decline in the down payment (from 5 to 3.5 percent) results in a 1.6 percent increase in the required qualifying income. As the down payment decreases, the required income to qualify for the same median-priced home increases.
The THAI for each down payment is shown in Table 3. Affordability declines as the down payment declines. In 2016, for the Austin-Round Rock MSA, the THAI measured 1.54 for a 20 percent down payment, 1.37 for a 10 percent down payment, 1.30 for a 5 percent down payment, and 1.28 for a 3.5 percent down payment.

Furthermore, a lower down payment may result in additional charges and fees to the homebuyer, such as private mortgage insurance. Lenders may also raise mortgage interest rates to compensate for the risks associated with lower down payments. This would increase the required qualifying income and reduce housing affordability.
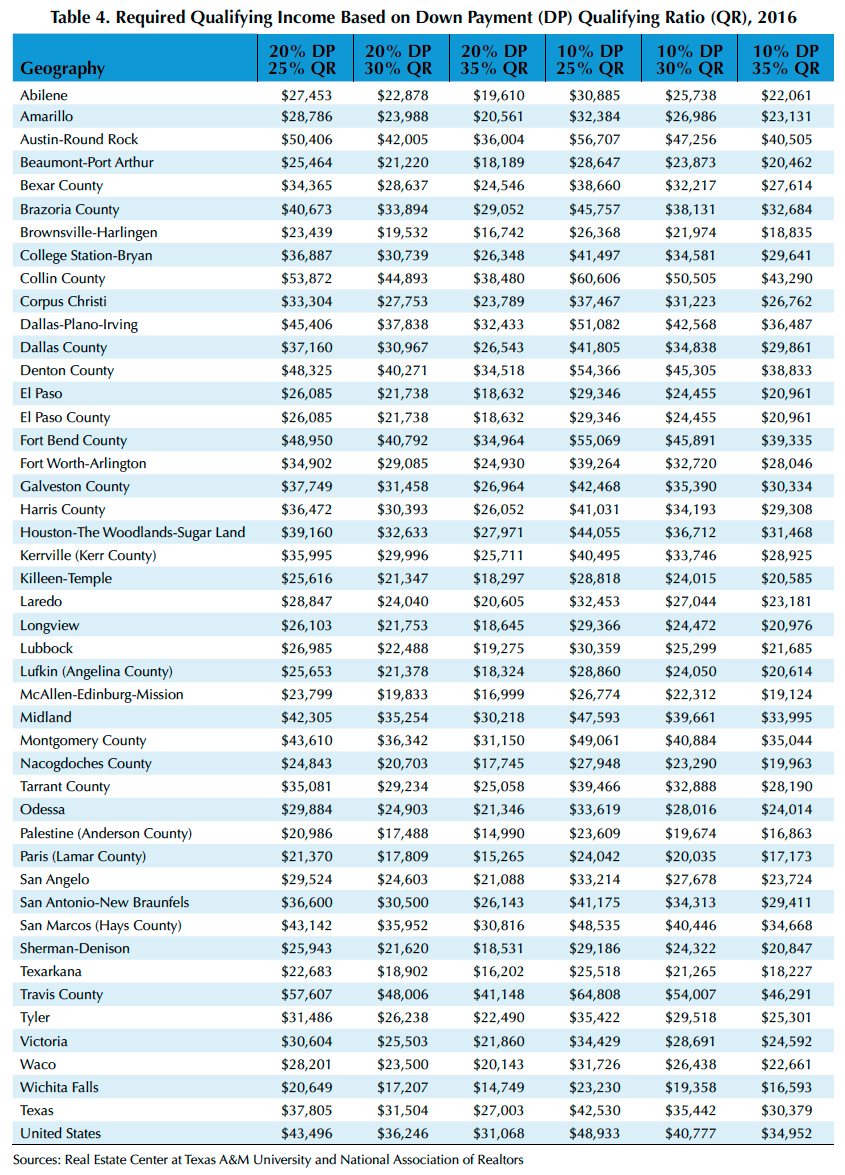
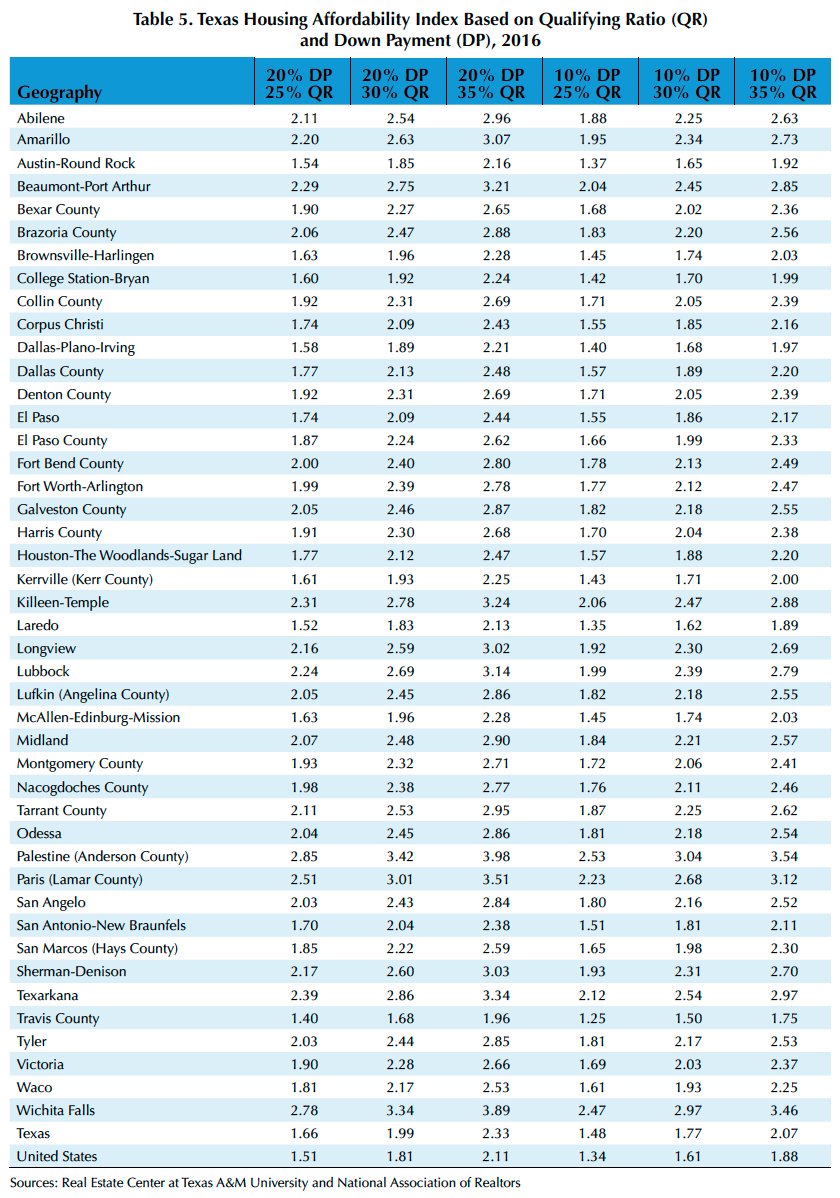
Changes in the qualifying ratio, or front-end debt-to-income (DTI) ratio, also affect the required income to qualify for a mortgage loan. (The front-end DTI ratio considers debts arising solely from homeownership, such as the monthly mortgage payment, whereas the back-end DTI considers other household debts, such as credit cards and student loans.) As the qualifying ratio increases, the required qualifying income decreases (Table 4). This is because the family can spend a higher percentage of monthly income on the mortgage payment. Currently, the front-end DTI ratio for FHA loans is 31 percent; however, the lender can authorize a higher ratio subject to approval from the FHA. Table 5 shows the increase in affordability as the qualifying ratio increases.
Historical Perspective
In 2016, the statewide THAI was 1.66. Given the financing assumptions, a family that earned the median income in 2016 made 66 percent more than was necessary to qualify for the median-priced home. In contrast, the index for the U.S. was 1.51, making Texas slightly more affordable than the nation.
The THAI indicates Texas has routinely outperformed the U.S. in terms of housing affordability (Figure 1). However, the gap between the two indexes has narrowed since the recovery from the housing crash.
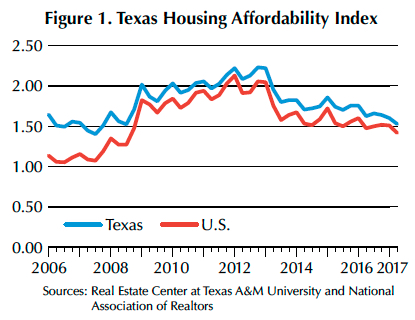
After peaking at the end of 2012, housing affordability for both Texas and the U.S. diminished. By the end of 2012, the index for Texas was 22 percent above its 2006–12 average, while the index for the U.S. was 30 percent above its average. By the end of 2016, the indexes for Texas and the U.S. were 8 and 16 percent below their respective 2013–16 averages.
The nationwide increase in affordability from 2008 to 2012 can be attributed to the decline in home prices and mortgage interest rates (Figures 2 and 3). In Texas, home prices remained fairly stagnant until an uptick in 2012. Falling mortgage interest rates and growth in median family income contributed to higher affordability from 2008 to 2012 (Figure 4).

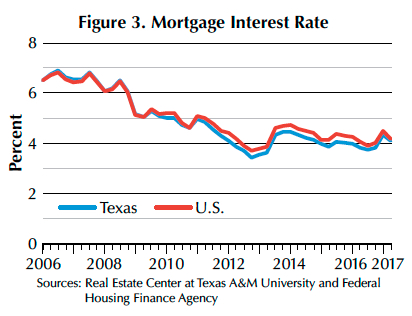

The decline in statewide housing affordability since 2013 stems from the rise in median home prices and slower growth in median family income. Meanwhile, interest rates have not fluctuated significantly since 2012. The median home price in Texas increased dramatically—nearly 34 percent—from 2012 to 2016. The national median home price increased slightly less—nearly 33 percent.
All Texas MSAs were more affordable than the United States in 2016. Wichita Falls had the highest level of affordability due to a low median home price ($114,700) relative to median family income ($57,400). Laredo exhibited the lowest level of affordability as a result of the low median family income ($43,900). Of the five major markets, Fort Worth-Arlington was the most affordable with an index of 1.99 (the DFW metro area is separated into two markets, Dallas-Plano-Irving and Fort Worth-Arlington).
Austin was the least affordable of the five major markets with an index of 1.54 in 2016. The median home price for the Austin MSA ($280,000) was the highest among all the MSAs in 2016. The index for Travis County measured 1.40 in 2016, indicating lower housing affordability compared with the nation. Travis County was the only area with an index lower than that of the U.S. in 2016.
Mortgage Interest Rates Implications
Affordability may continue to decline in the near future. An anticipated rise in mortgage interest rates will increase the required monthly payment, and, as a result, the required qualifying income. Goldman Sachs has predicted mortgage interest rates will rise to 5.5 percent by 2019.
A $200,000 home with an 80 percent, 30-year loan at 6.69 percent (the annual rate for Texas in 2006) requires a monthly mortgage payment of $1,031.65. The homebuyer needs to earn an annual income of $49,519 to qualify for a loan.
In this scenario, the price-to-income ratio is 4.04 ($200,000 / $49,519). As the price-to-income ratio increases, the gap between median home price and required qualifying income also widens. Affordability increases as required qualifying income decreases relative to the home price. In essence, a higher ratio implies that buyers can purchase more housing relative to income.
The monthly mortgage payment to purchase the same $200,000 home at a rate of 5.5 percent decreases to $908.46. The homebuyer would need to earn an annual income of $43,606 to qualify for a loan, setting the price-to-income ratio at 4.59.
To purchase the same $200,000 home at the statewide 3.85 percent rate for 2016, the monthly mortgage payment is $750.09, while the required qualifying income is $36,004. The price-to-income ratio measures 5.55. A nearly 3 percent drop in the interest rate resulted in a 27 percent decline in the required qualifying income for an 80 percent loan.
Price-to-Income Ratio
The price-to-income ratio can also be computed using median household income rather than required qualifying income. Median household income captures housing affordability for all households, as opposed to only families.
In this instance, a lower price-to-income ratio is favorable, as it indicates a household earning the median income should have sufficient income to qualify for the median-priced home. Households should generally be able to qualify for a home priced between 3.0 and 3.5 times their annual income. A ratio above 4.0 suggests that home prices are teetering toward a level that cannot be supported by the median household income.
Prior to the housing crash, the price-to-income ratio
for the U.S. hovered above 4.5, before dropping precipitously during the height of the crash (Figure 5). After rebounding in 2013, the ratio has crept upward. By the end of 2016, the ratio for the U.S. was 4.09. Significant growth in median home price coupled with slow growth in median household income contribute to the larger ratio. From 2006 to 2016, the national median household income grew, on average, nearly 2 percent per year.
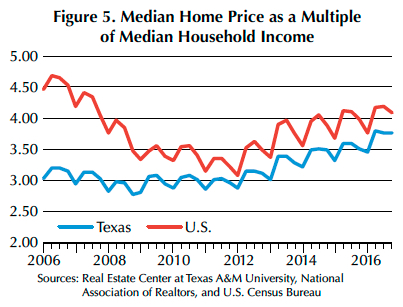
The average price-to-income ratio from the beginning of 2006 to the end of 2016 measures 3.80 for the U.S. and significantly less for Texas at 3.18. Since 2006, the ratio for Texas has remained below that of the U.S. but the gap between the two has narrowed in recent years.
The price-to-income ratio for Texas hovered around 3.0 prior to the recession as well as in the years immediately following. Since mid-2012, the ratio has exceeded 3.0 and has hovered around 3.5 since mid-2014. By the end of 2016, the ratio measured 3.77.
____________________
Dr. Gaines ([email protected]) is a chief economist and Losey a research assistant with the Real Estate Center at Texas A&M University.
You might also like

TG Magazine
Check out the latest issue of our flagship publication.