


Ebb and Flow
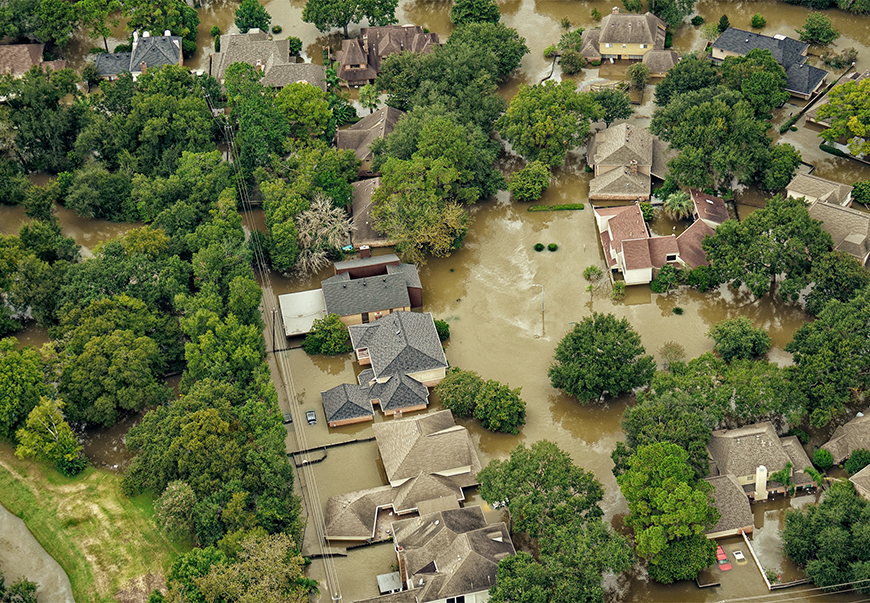

While it’s still too early to determine Hurricane Harvey’s long-term impact on Houston’s housing market, the city’s history of flooding provides clues on what to expect. Neighborhoods near bayous and waterways suffered severe flood damage, but, overall, the housing market emerged from the storm in relatively good shape. |
Geographically, the Houston-The Woodlands-Sugar Land Metropolitan Statistical Area is one of the largest metropolitan areas in the nation. Despite fluctuations in the oil market, it is also one of the most densely populated metros with steady household growth. When Hurricane Harvey hit the Texas Gulf Coast in late August and unleashed unprecedented levels of rain in a short time, Houston received the bulk of property damage due to its size. Total damage estimates are anticipated to rival other catastrophic hurricanes such as Sandy and Katrina.
Short- and long-term economic losses could be severe. How will this storm and its torrential flooding affect area home sales? While it is still too early to judge the storm’s total long-term impact, Houston has a long history of storms and floods to guide expectations.
Using the Data Relevance Project (a research agreement with the Texas Association of Realtors), the Real Estate Center took a top-down geographic approach to Harvey’s impact on Houston’s housing market. The Center analyzed housing sales throughout the metro and individual counties, neighborhoods near major waterways, and one particular area that has been hit hard numerous times by recent floods. The goal was to help model possible outcomes for similar markets impacted by Harvey. The Houston metro comprises Austin, Brazoria, Chambers, Fort Bend, Galveston, Harris, Liberty, Montgomery, and Waller Counties.
Before the Storm
By August Houston home sales were on track to exceed 2016, which already was an impressive year compared with the prior one. Second-quarter year-to-date (YTD) sales totaled 41,287 in 2017 versus 38,753 in 2016. July was another good month for sales with 7,695 homes sold, a 2.6 percent year-over-year (YOY) increase (Figure 1).
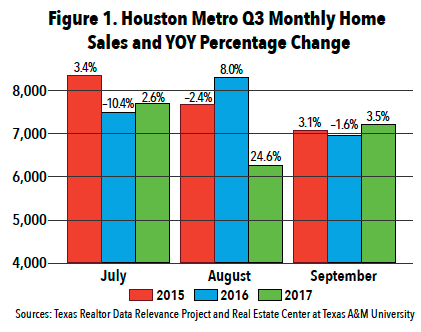
The region’s sales momentum halted in August, dropping 24.6 percent. Even though Harvey hit Houston in late August, overall sales volume fell drastically compared with both July 2017 and August 2016. The sales drop permeated the region as the city’s attention shifted to disaster response. Among the hardest-hit counties were Fort Bend, Galveston, and Harris—three of the metro’s most populated counties, and those closest to the coast (see table).

Rather than continue August’s sales plummet, September home sales actually improved, ending the month 3.5 percent ahead YOY with 7,209 sales. However, because title companies and local banks had to cease operations at the end of August, holdover August sales carried forward into September, possibly contributing to the bounce back.
Overall, third-quarter sales fell to 21,154, down more than 7 percent from 22,777 in 2016.
Down on the Bayou
Houston is near numerous bodies of water. Lake Houston is to the northeast and the Trinity River and Galveston Bay is to the southeast. The region includes a vast array of bayous, giving Houston the nickname “Bayou City."
Many of the bayous and waterways—including Brays Bayou, Buffalo Bayou, Spring Creek, Willow Creek, and White Oak Bayou—are adjacent to the region’s most densely populated areas. Unfortunately, many homes in these areas fell victim to Harvey’s massive flooding.
While flooding along Houston’s bayous wasn’t unheard of before the storm, Harvey’s record-setting rainfall greatly magnified the reach and magnitude of flooding into neighboring residential areas. Home sales in neighborhoods near major bayous and creeks were impacted the heaviest in terms of sales volume. The metro dipped around 7 percent in third-quarter sales, but areas within one mile of these waterways fell between 16 and 22 percent (see table).
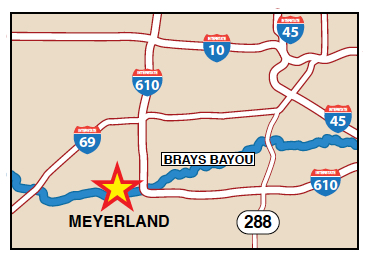
Case Study: A Closer Look at Meyerland
Flooding has become more problematic for Houston as commercial and residential development has expanded and drainage areas have diminished. In recent years, catastrophic flooding has almost become the new norm.
Meyerland, southwest of downtown Houston and near one of the city’s major bayous, has had more than its share of flooding in recent years. The 2015 Memorial Day flood was followed by the April 2016 Tax Day flood and, in 2017, Hurricane Harvey. The Center analyzed the short- and long-term impact repeat flooding had on sales volume, price per square foot (PSF), and days on market since the start of the decade in the general Meyerland area. As a reference point, Harris County was used to compare the study area with the overall market trend.
Note that larger markets with more activity tend to have less month-to-month variation than smaller markets, making trends trickier to identify in smaller markets. The blue lines in the figures illustrate these trends.
At the start of the decade, Harris County home sales were on the rise largely because of rising oil prices, but growth began to stall in 2014 shortly after oil prices fell (Figure 2). In Meyerland, sales volume began declining in 2014 and was still declining when the Memorial Day flooding hit in May 2015. Meyerland had a decent May, with sales volume matching that of May 2014, but then sales dipped in June. Harris County had a few months of positive sales growth to start off the summer. Both markets had a considerable drop about five to six months after the Memorial Day flood before almost immediately bouncing back.

In the months that followed the Tax Day floods almost a year later, home sales increased. Just like in May 2015, the two to three months after the flood showed little, if any, decline in sales. This time Meyerland had another delayed shock to sales while Harris County did not.
Hurricane Harvey had a more drastic immediate impact on sales in both Meyerland and Houston. By December, Meyerland sales soared with their highest volume since 2013. Harris County also bounced back to continue its gradual positive trend.
Like sales, price PSF in Harris County began to rise exponentially with the rise in oil prices. Home prices continued to rise after 2014 but at a slower pace. In Meyerland, median price PSF started to peak in 2014 (Figure 3).

Shortly after the Memorial Day flood, a noticeable shock in prices occurred, but prices bounced back before the Tax Day flood. The immediate price drop may be explained by sellers who simply wanted out of the area and were willing to accept a price discount. A similar trend occurred in Meyerland shortly after Tropical Storm Allison. According to Meyerland resident and Beth Wolff Realtors President Ed Wolff, “Many of those initial sellers were long-time residents who had built enough equity over time to then accept lower offers."
Wolff said prices increased sharply several months later as properties with major post-flood renovations came online and boosted prices. After April 2016, there was no obvious shock to prices like the year before, but price PSF began to fall. Price drops accelerated following Hurricane Harvey, at least in the short run.
Because Meyerland and Harris County are different markets, home price behavior varies between the two. At the time of publication, homes in Meyerland averaged $150 PSF while Harris County averaged slightly above $100 PSF. The price differences could help explain why Meyerland price levels flattened, possibly at a natural price ceiling, while Harris County levels continued rising.
Finally, the Center looked at days on market to compare the total home marketing period between Harris County and Meyerland. As expected with rapid rising home sales, days on market quickly diminished before 2014 (Figure 4). Days on market in Harris County climbed at a moderate pace. Meyerland displayed a similar pattern except there was a noticeable rise a few months after the Memorial Day flood. In April 2016, when the Tax Day flood occurred, the upward trend began to stabilize. In the months immediately following Harvey, days on market fell to their lowest levels since 2015.

While both the Memorial Day and Tax Day floods were devastating to Meyerland, those floods had a mixed impact on overall housing in Harris County. Ultimately, with the exception of price PSF, Meyerland shared the same overall trends as the county over the long term. Median price PSF in Meyerland started to diverge from the county in May 2015 after the first major flooding event. Sales and days on market for Meyerland, on the other hand, rose and fell with the county. The big difference at the local market level is the magnitude of short-term shocks.
Houston Still Strong
Factors such as relative location, broader supply-and-demand trends, and the regional economy can have overriding effects on local market conditons. This may have helped keep Meyerland’s housing market relatively on track with the county trend. Some of the storm’s effects will take several months to materialize. Some markets may have a longer recovery period than in the past because of the greater magnitude of damage. Even so, Houston’s housing market still looks strong.
For more on this story, listen to episode 381 of the Real Estate Red Zone podcast. For a general year-end summary of Houston housing, read “Houston Housing: Weathering a Challenging Year."
____________________
Roberson ([email protected]) is a senior data analyst with the Real Estate Center at Texas A&M University.
You might also like

TG Magazine
Check out the latest issue of our flagship publication.