


Imperfect Storm

Hurricane Harvey disproportionately affected northeast Houston where income levels are among the city’s lowest. The immediate impact temporarily shocked housing sales and left supply-and-demand measures relatively unchanged. |
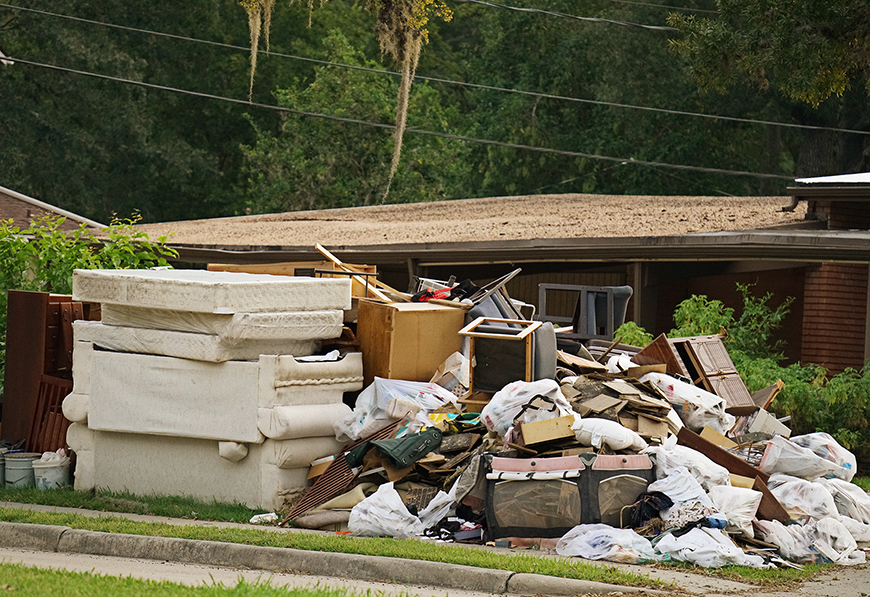
Hurricane Harvey poured 40-plus inches of rain across the city of Houston, paralyzing economic activity for nearly a week. The rain and ensuing floods damaged an estimated $80 billion worth of assets along Texas’ Gulf Coast, making it the costliest storm in state history. The Federal Emergency Management Agency (FEMA) reported more than 161,000 homes damaged in the Houston Metropolitan Statistical Area. Of those, 24 percent were uninhabitable for at least 30 days. Alarmingly, 83 percent of Houstonians had no flood insurance based on estimates from the Institute for Regional Forecasting at the University of Houston, augmenting the financial difficulties in the recovery process.
Harvey’s occurrence marked the third consecutive year of a multibillion-dollar storm in Houston, prompting reevaluations and reviews of flood infrastructure, urban planning, and building regulations. Change may be necessary to withstand future storms without inhibiting economic growth as businesses reassess the desirability to locate or remain in Houston. Understanding the current city structure and how it developed helps local leaders enact new policies. Identifying vulnerable regions, as well as the underlying causes of that vulnerability, is paramount to Houston’s future prosperity.
Disproportionate Damage
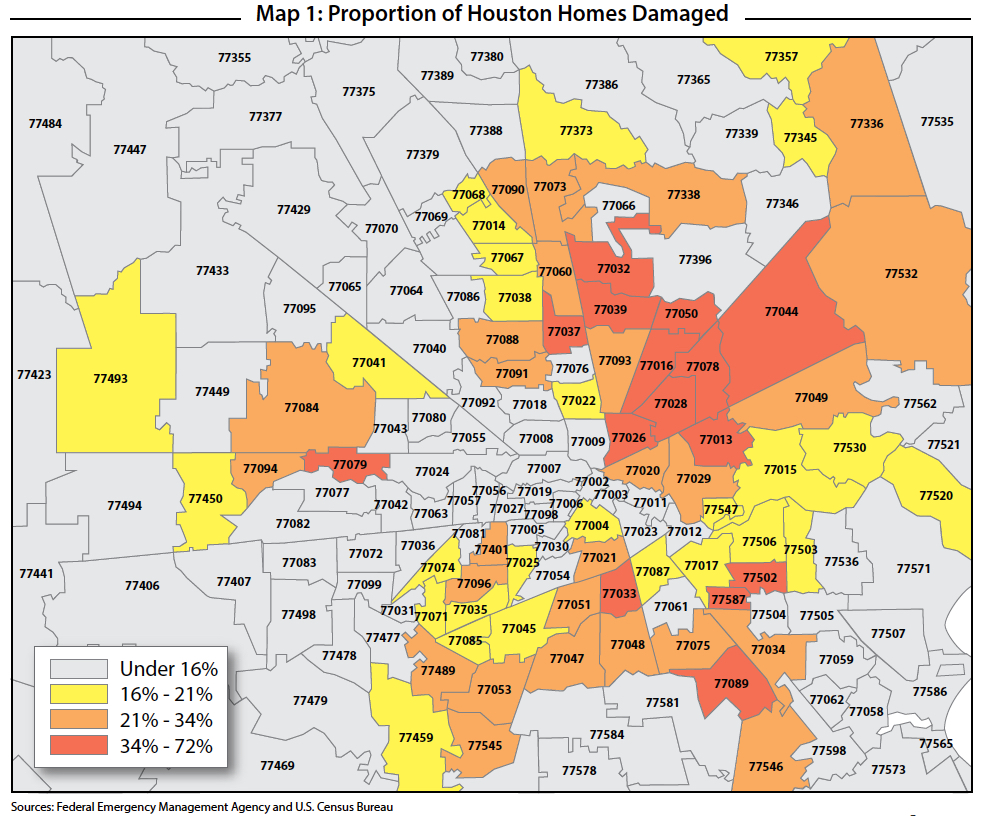
While flooding stretched across Houston, the destruction was unevenly distributed (Map 1). Geographically, the northeast suffered disproportionately, followed by the region south of downtown. The most concentrated destruction occurred in two contiguous ZIP codes (77078 and 77028), where around 70 percent of homes incurred damages (see table). Both regions (which comprise the communities of East Houston, Houston Gardens, and Settagast) contain stretches of Halls Bayou, which flows into Greens Bayou on the eastern edge of 77078. The next most-damaged ZIP codes (77026 and 77044) were also in northeastern Houston or on Halls Bayou (77037), where about half of the housing stock reported damage.

Adding to the devastation, the most damaged regions also had the lowest incomes. Four of the most-damaged ZIP codes ranked in the bottom tenth income percentile for Houston based on average income per tax return in 2015 (Map 2). In fact, residents in only one of the ten most-damaged ZIP codes (77044) earned above the median income level of $53,657. Despite its economic advantage, this area was particularly vulnerable to flooding from Lake Houston, Sheldon Lake, and Greens Bayou.
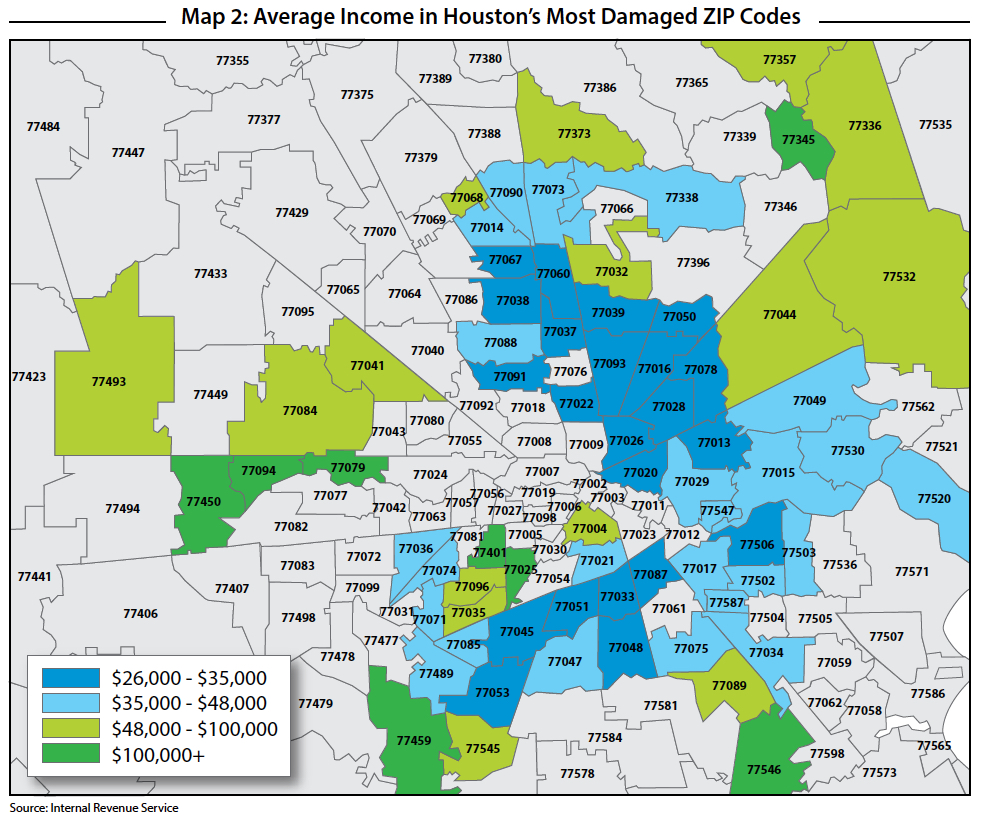
Only four of the 30
least-damaged ZIP codes earned
below the median income level. However, wealthy regions were not immune to Harvey’s wrath. More than a quarter of homes reported damage in Bellaire (77401), an independent city within Houston’s boundaries where income levels ranked in the top 5 percent. Two ZIP codes surrounding George Bush Park (77079 and 77094) suffered similarly and ranked in the top 10 percent.
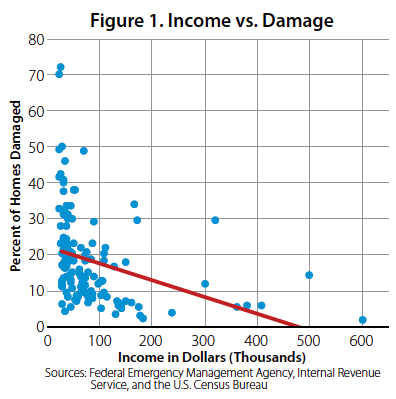
In general, the proportion of homes damaged by Hurricane Harvey was negatively associated with income levels (Figure 1), but the nature of the relationship is unclear. Income explained only a tenth of the variation in proportional damages. The unexplained variation suggests several other factors determined the distribution of Harvey’s destruction. These determinants could include proximity to bayous or reservoirs, urban density, and varying flood control infrastructures.
Harvey’s Temporary Housing Shock
Despite Harvey’s historic magnitude, the storm provided only a momentary shock to the Houston housing market. Housing sales plummeted 25 percent year over year when Harvey landed in August but quickly rebounded to their year-long, flat trend. Single-family building permits fell 22 percent before approaching record levels as builders responded to the damaged housing stock. The combination of decreased supply and displaced residents elevated home prices, a trend likely to continue amid skilled-labor shortages in the construction industry.
The storm had little effect on homes in active developments, straining predominantly the existing home stock. Resale listings sank 6 percent between August and September, pulling the months inventory down to 3.3 months. On the demand side, the average days on market for resale homes increased three straight months following Harvey, reflecting a decreased appetite for existing home purchases. However, the supply shock outweighed sluggish demand, pushing the median resale price to a record high of $222,761 in January 2018.
Movements in the existing home market are increasingly important for low-income areas where new home construction is less common. Four of the five most-damaged ZIP codes, which happen to be low-income areas, have had minimal sales activity since 2011 (Figure 2), averaging between five and seven sales per month. The income outlier (77044) observed a healthier volume at 56 sales per month but reached a peak earlier in 2017.

The five ZIP codes all posted seasonally adjusted sales declines in August, illustrating Harvey’s initial negative impact. However, the contraction coincided with obvious downward trends that began in late 2016, resembling Houston’s overall stagnant sales activity over the past year. ZIP code 77078, which incurred the most damage, maintained stable sales before and after Harvey, given a demand resurgence in 2017. However, demand generally weakened in the low-income, east-side communities following the storm.
Despite stagnant sales activity and low-income levels, home price appreciation in these ZIP codes outpaced overall Houston price appreciation (see table). Since 2011, growth in the median price per square foot (PSF) more than doubled in three of the afflicted regions (77026, 77028, and 77078) and rose 59 percent in 77036, outpacing Houston’s 45 percent growth overall. ZIP code 77044 was the exception given its above-average sales volume, with 32 percent growth in median PSF over the seven-year period.
Potential Impact of New Policies
The highest proportion of housing damage occurred northeast of downtown in economically disadvantaged neighborhoods. These regions consist primarily of existing homes, suggesting that new building regulations may have little impact on the most vulnerable areas. Residents there may have an increasingly difficult time financing housing modifications, such as physically elevating homes to comply with proposed building codes. Additionally, rapid home price appreciation heightens financial burdens for these residents as rising property taxes further strain disposable income levels.
Note: Monthly data are seasonally adjusted.
____________________
Dr. Torres ([email protected]) is a research economist and Wesley Miller ([email protected])
a research associate with the Real Estate Center at Texas A&M University.
You might also like

TG Magazine
Check out the latest issue of our flagship publication.