


Coming Soon


The Center is working on a commercial real estate report that will present forward-looking insights and opinions regarding rents, vacancy, new construction, employment, and net absorption. |
The Real Estate Center is about to produce its first recurring commercial real estate (CRE) report,
Texas Commercial Trends.
The quarterly report will cover the office, retail, and industrial warehouse sectors in four major Texas metropolitan statistical areas (MSAs): Austin, Dallas-Fort Worth, Houston, and San Antonio.
Figures in the report will display historical trends in rents, vacancy, new construction, employment, and net absorption as far back as data are available. However, the primary purpose is to estimate the future direction of rental rates and construction activity in the four MSAs.
Forward-looking insights and opinions will be based on output from econometric models updated each quarter with the most current economic and CRE data. For readers interested in a more in-depth discussion of historical CRE trends in the four MSAs, see the Center’s January 2016
Tierra Grande, “Trends: Texas Commercial Real Estate."
The report will provide a broad, market-level look at future changes in rental rates and new construction for the three CRE property types. However, rental rate or development decisions CRE professionals make regarding a specific property or development may be quite different.
Commercial real estate markets can be important indicators of local economic conditions. In general, an economy that supports population and employment growth and business expansion should experience a rise in commercial rents and new construction.
Using Natural Vacancy Rate, Future Rental Rate Trends
At the market level, the optimal or “natural" vacancy rate for existing CRE is defined as the point where no “real" (inflation-adjusted) changes in the market rental rate will occur. While actual vacancy rates continually change, natural vacancy is generally stable over time.
When the actual vacancy rate falls below (rises above) natural vacancy, the change in demand for space should encourage landlords to increase (decrease) rents. The wider the gap between actual and natural vacancy, the greater the potential for a change in market rents.
Future Construction Growth, Natural Vacancy
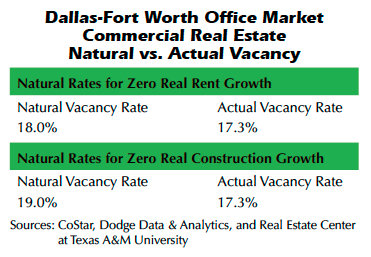
The relationship between actual and natural vacancy can trigger developers to construct new commercial space. Natural vacancies used to estimate trends in new CRE construction are calculated separately from those used to estimate rental rate trends (see table), although they often have the same value.
Dodge Data & Analytics provides the data source for construction values used to estimate the natural vacancy rate. The values reflect total contract amounts in real dollars for new CRE developments in the pipeline at the time.
Vacancy and total real dollar value of future new construction are generally inversely related. As actual vacancy increases above (decreases below) natural vacancy, new construction activity will tend to decrease (increase).
Construction values can be affected by variables unrelated to vacancy such as the cost of materials or labor. However, quarterly changes in these variables should have much less impact on market-level construction values when compared to the totality of all decisions to construct or not construct additional new space.
Factors such as quantity of land available for CRE development or local zoning and regulatory restrictions can impact new construction. Such differences usually appear between markets, as when comparing development restrictions among the four Texas MSAs.
The report will provide figures showing the square footage of CRE under construction each quarter. CoStar Group is the source of the raw data.
A comparison of Dodge and CoStar construction data generally shows changes in construction contract values lead to changes in properties under construction by about one to two quarters. As a result, Dodge data should act as a leading indicator of the direction new construction volume takes in CoStar’s data.
CoStar data used in the report will not include any owner-occupied space. However, the data for construction values provided by Dodge does include new space being built for owner-occupants. Keep this in mind when comparing trends in construction values to trends in square footage actually under construction. The two trends may vary when a significant amount of owner-occupied space is being built.
Data Modifications
Data used in the report will be subjected to a variety of adjustments to produce a pure look at future rental rate and construction trends. No raw, unadjusted data from CoStar or Dodge will be quoted or reproduced in the publication. All data are quarterly.
The six data series included in the analysis are:
- asking rental rates,
- actual vacancy rates,
- net absorption,
- construction dollar values,
- square footage under construction, and
- employment.
All six datasets will be seasonally adjusted and detrended.
Over time, seasonal variation in a data series may be a result of changes that occur in the same month or quarter every year. For example, employment may regularly increase in the fourth quarter each year due to Christmas and then decrease in the first quarter. Adjustments for such seasonal effects eliminate these fluctuations so that true underlying trends in the data can be isolated and identified.
Variability in a data series may also be caused by totally random influences not related to seasonality. These random effects make it difficult to separate real information about trends from data “noise." A further detrending process removes as much of this random noise as possible after the seasonal adjustment.
Two variables denominated in dollars — rental rates and construction values — will be adjusted for inflation. In this way, the value of a dollar remains constant over the period being analyzed for an apples-to-apples comparison in “real" dollars versus unadjusted or “nominal" dollars.
Construction value data in the report will be converted to an index rather than a change in dollar amount. The initial value of the index begins at 100 from the base period. The change in construction values from some starting point is easier to determine using an index. For example, if real construction values doubled from 1Q2000 to 4Q2010, the index number at that time would be 200. Alternately, if values dropped to half the original level, the new index value would be 50.
A comparison of net absorption to employment growth in the report offers insight into the future direction of net absorption based on changes occurring in employment. Net absorption is defined as the total increase in square footage occupied in a particular market minus the total square footage tenants vacated during a given period.
Employment data will be restricted to specific subcategories that directly correlate to each CRE property type. For the office market, financial services and professional and business services employment is used. For the retail market, retail trade employment are used. For industrial warehouse, the subcategory is transportation and utilities employment.
A data limitation will be that CoStar can only provide “asking" rents, the rental rates being
offered to tenants by landlords. The “effective" rental rate, the rate after any concessions such as free rent or extra money for tenant improvements, may be different.
Effective rents cannot be obtained for analysis because they are proprietary information. The difference between actual and effective rents generally are greatest during periods of weakness in CRE markets.
Possible Report Uses
The report will provide CRE professionals and other users insight into rental rate and construction trends over the next one to two quarters. For example, as actual market vacancy rates tighten and begin to approach the natural vacancy rate, they can act as a signal to developers to prepare for more construction activity ahead.
Landlords and tenants can also look for further pressure on market rents. This could be a signal that they can begin to raise rents in the coming months.
Monitoring trends in vacancy and rental rates and projected future construction may help prepare city planners for possible changes in a community’s land-use patterns, zoning, or infrastructure planning as need for new CRE development begins to expand. Contract values are a better indicator than building permits, because not all issued permits result in actual construction.
Example: Dallas-Fort Worth Office Market
An analysis of trends for the DFW office market as of 2Q2017 show how the commercial report will be structured. Accompanying tables and figures are meant to support the report’s insights and opinions.
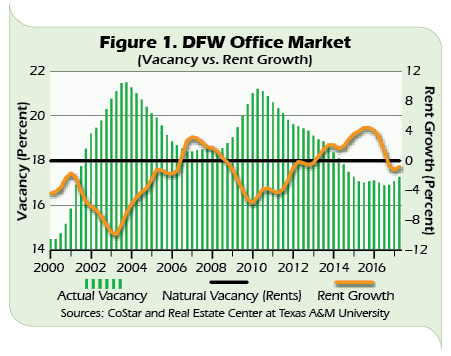
The natural vacancy calculation for the DFW office market produced a rate of 18 percent compared with 17.3 percent actual vacancy (see table). The relatively small difference between the two rates makes the potential for an increase in market rents quite small. Actual vacancy has been trending higher in the last three quarters (Figure 1).
The possibility for slower rental growth is reinforced by the recent direction of net absorption (Figure 2). Although office-sector employment growth has trended up, net absorption has weakened steadily in current quarters.
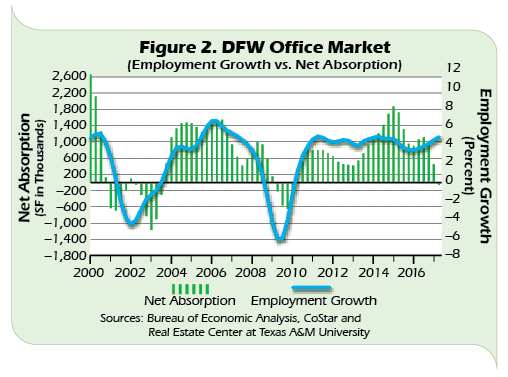
One explanation for the increase in office-related employment could be recent construction of owner-occupied office campuses. For example, Plano’s Legacy West development will be the new home of several corporate tenants, including Toyota North America and JP Morgan Chase. Net absorption does not capture such corporate facilities.
This may explain the disparity between construction values (Figure 3) and square footage under construction (Figure 4) from 2015–16. Construction values were showing a strong increase, while the upward trend in square footage under construction was not as substantial.


The larger difference between natural vacancy (19.0 percent) and actual vacancy (17.3 percent) for construction activity indicates a chance for more new construction (see table and Figure 3). The recent highly positive move in construction values (Figure 3) reinforces this notion.
Although the trend for construction values has turned up, actual space under construction (Figure 4) does not yet reflect the increase. A lag is expected between construction values and actual square feet under construction. The next few quarters should show a positive turnaround in actual space under construction.
____________________
Dr. Hunt ([email protected]) is a research economist and Losey a research assistant with the Real Estate Center at Texas A&M University.
You might also like

TG Magazine
Check out the latest issue of our flagship publication.