


Getting Back on Track


An understanding of real estate market cycles can help market participants make more informed production and investment decisions. The Real Estate Center’s recent study shows housing markets are in the final stages of a recovery that began after the Great Recession. |
A Real Estate Center study finds Texas housing markets are in the final stages of a recovery that began in the aftermath of the Great Recession (GR). In the absence of a major shock to the U.S. and Texas economies, the state’s major housing market indicators are projected to move toward their long-term, steady-state average growth rates.
Texas Housing Cycles
Texas housing market time series data used for this study run from January 1990 to December 2017. Figure 1 presents time series of annual growth rates of home sales in Texas together with the filtered home sales growth rates. Patterns or trends in the unfiltered growth rate series (blue line) are difficult to discern. By contrast, cyclical movements in the filtered growth rate series (black line) are easier to recognize.
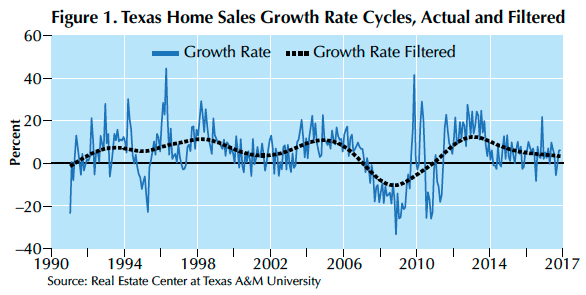
Figure 2 shows three distinct periods of home sales growth rates between 1990 and 2017. The first period coincided with the longest period of U.S. economic expansion, lasting 132 months from March 1990 to March 2001 and ending in the bursting of the dot-com bubble. The second period occurred in the aftermath of the dot-com bubble and ended in the GR. Currently, the state’s housing markets are in their third cycle, which began in the aftermath of the GR. Recovery from the GR was engineered by the Federal Reserve reducing interest rates to historically low levels.
The state’s home sales growth rate cycle began its post-GR recovery in October 2008, peaked at 12.4 percent in February 2013, and since then has cooled off with slower growth rates, falling to 3.9 percent in December 2017. That is below the average growth rate of 5.1 percent from January 1990 to December 2017 (Figure 2). This indicates an upward trend toward the long-term growth rate of 5.1 percent after bottoming out in 2019.

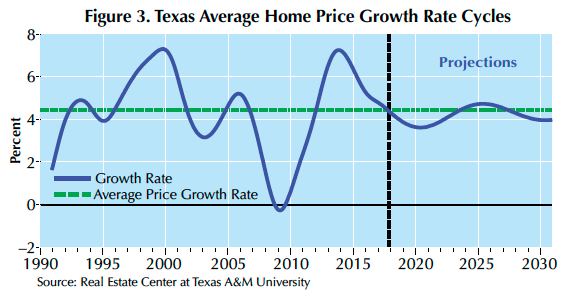
The Texas average home-price growth rate cycle (Figure 3) shows similar economic expansions and declines for the state’s housing markets from 1990 to 2017. The state’s post-GR home-price growth rate recovery peaked at 7.2 percent in December 2013 and decreased to 4.4 percent in December 2017, lower than the 4.5 percent average growth rate for the period from January 1990 to December 2017. The model for projecting home-price growth rates indicates fluctuation around the 4.5 percent long-term growth rate beginning in 2018.
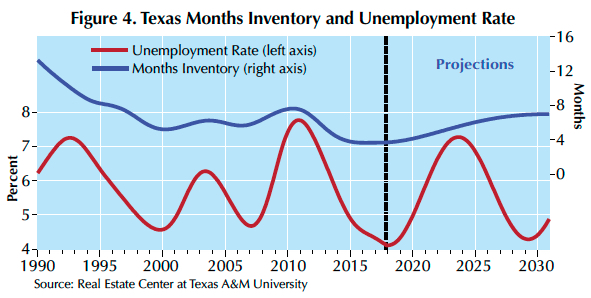
Months inventory (the number of homes on market divided by average monthly sales) summarizes the relative strengths of the supply-and-demand sides of local housing markets and measures how fast homes are sold. The research found close comovements between months inventory and the state’s unemployment rates (Figure 4). There was a correlation coefficient of 0.67 between filtered months inventory and unemployment rate for 1990–2017 and 0.77 for 2000–17. Texas had more than 13 months of housing inventory in the early ’90s in the aftermath of the state’s real estate market collapse in the late ’80s. A long downward trend reduced the state’s months inventory to a historically low level of 4.1 months in December 2017. However, months inventory is likely to begin trending upward.

Housing Cycles of Major Texas Metropolitan Areas
Houston-The Woodlands-Sugar Land, Dallas-Fort Worth-Arlington, San Antonio-New Braunfels, and Austin-Round Rock account for more than two-thirds of the state’s gross domestic product, income, and employment. The Center’s housing cycle analysis compared Houston and Dallas, which accounted for about 25 and 29 percent of the state’s economy, respectively, and San Antonio and Austin, each accounting for about 8 percent.
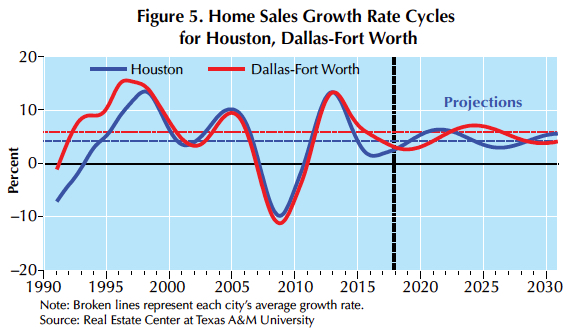
Home sales growth rate cycles for Houston and Dallas moved in tandem from 1997 to 2013. They began diverging in 2014 because of the impact of falling oil prices on Houston’s economy (Figure 5). Like the state’s home sales growth rate cycle, Houston’s and Dallas’ cycles reached their post-GR peaks of more than 13 percent in February 2013 and since then have trended downward. Since 2015, Houston’s growth rate has been smaller than the long-term average growth rate of 4.3 percent, but it is projected to bottom out in 2018 and trend toward its long-term average. Dallas’ growth rate is currently lower than the long-term average growth rate of 5.8 percent. It is projected to bottom out in 2018 and trend toward the long-term average.
San Antonio’s and Austin’s home sales growth rate cycles were similar from 1998 to 2010, then they diverged (Figure 6). San Antonio reached its post-GR peak of 12.5 percent in August 2013. After that, rates fell and in 2017 were less than their long-term average growth rate of 7.7. Austin’s 15.9 percent peak in November 2012 was also followed by decreasing rates. They fell to less than their 7.1 percent long-term average growth rate in 2015. Home sales growth rates in both metros are projected to trend upward toward their long-term average growth rates after 2018.

Average home-price growth rate cycles for Houston and Dallas displayed close comovements from 1996 to 2014 (Figure 7). Since their 8.3 percent post-GR peak in November 2013, Houston’s home price growth rates have declined, falling to 1.9 percent in December 2017. The metro’s long-term average growth rate is 4.7 percent. By contrast, Dallas’ post-GR peak has remained steady at close to 8 percent, well above its long-term average of 4.1 percent. Dallas’ growth rates were smaller than Houston’s from 1996 to 2014, and the city’s current higher growth rates may reflect offsetting of those lower rates.

San Antonio and Austin had similar home-price growth rate patterns during and after the GR (Figure 8). San Antonio reached its post-GR peak of 5.9 percent in April 2014 while Austin reached its peak of 7.7 percent three months later. Since then, growth rates have decreased in both metros falling below the long-term growth rates of 4.5 percent for San Antonio and 5.9 percent for Austin. Both areas’ growth rates are projected to move upward toward their long-term averages after 2019.

Houston’s months inventory fell to a historically low 2.9 months in December 2014. Since then it has trended upward, reaching four months in December 2017, and is projected to exceed four months after 2018 (Figure 9). Dallas’ inventory fell to a historically low 2.2 months in July 2016 and has since trended slightly upward. It is projected to exceed four months after 2021.

San Antonio’s months inventory has trended downward in cycles from close to 20 months in 1990 to a historically low 3.3 months in December 2017. It is projected to trend upward (Figure 10). Austin’s months inventory reached its trough of 2.2 months in February 2015 and has since trended upward. It is projected to climb to around five months.


____________________
Dr. Anari ([email protected]) is a research economist with the Real Estate Center at Texas A&M University.
You might also like

TG Magazine
Check out the latest issue of our flagship publication.